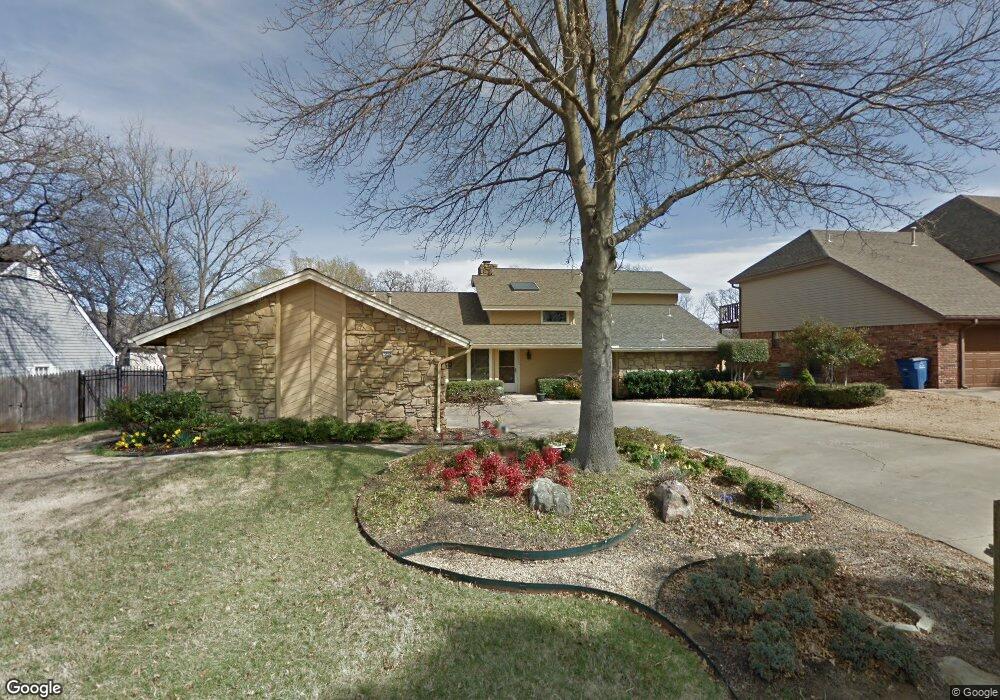
7313 S Fulton Ave Tulsa, OK 74136
Minshall Park NeighborhoodEstimated Value: $298,000 - $380,000
--
Bed
3
Baths
2,946
Sq Ft
$115/Sq Ft
Est. Value
About This Home
This home is located at 7313 S Fulton Ave, Tulsa, OK 74136 and is currently estimated at $339,338, approximately $115 per square foot. 7313 S Fulton Ave is a home located in Tulsa County with nearby schools including Key Elementary School, Memorial Middle School, and Memorial High School.
Ownership History
Date
Name
Owned For
Owner Type
Purchase Details
Closed on
Aug 23, 2023
Sold by
Shaw Gary Lynn and Shaw Marianne
Bought by
Shaw-Boshuizen Revocable Trust and Shaw
Current Estimated Value
Home Financials for this Owner
Home Financials are based on the most recent Mortgage that was taken out on this home.
Original Mortgage
$100,000
Outstanding Balance
$90,943
Interest Rate
6.11%
Mortgage Type
Credit Line Revolving
Estimated Equity
$248,395
Purchase Details
Closed on
Aug 24, 2017
Sold by
Shaw Gary Lynn and Boshuizen Marianne
Bought by
Shaw Gary Lynn and Boshuizen Marianne
Purchase Details
Closed on
Apr 23, 2001
Sold by
Adams Donald Lee and Admas Linda Lou
Bought by
Shaw Gary L and Boshuizen Marianne
Purchase Details
Closed on
Jun 1, 1982
Create a Home Valuation Report for This Property
The Home Valuation Report is an in-depth analysis detailing your home's value as well as a comparison with similar homes in the area
Home Values in the Area
Average Home Value in this Area
Purchase History
| Date | Buyer | Sale Price | Title Company |
|---|---|---|---|
| Shaw-Boshuizen Revocable Trust | -- | None Listed On Document | |
| Shaw Gary Lynn | -- | None Listed On Document | |
| Shaw Gary Lynn | -- | None Available | |
| Shaw Gary L | $190,000 | -- | |
| -- | $29,500 | -- |
Source: Public Records
Mortgage History
| Date | Status | Borrower | Loan Amount |
|---|---|---|---|
| Open | Shaw Gary Lynn | $100,000 |
Source: Public Records
Tax History Compared to Growth
Tax History
| Year | Tax Paid | Tax Assessment Tax Assessment Total Assessment is a certain percentage of the fair market value that is determined by local assessors to be the total taxable value of land and additions on the property. | Land | Improvement |
|---|---|---|---|---|
| 2024 | $3,465 | $28,151 | $3,435 | $24,716 |
| 2023 | $3,465 | $28,302 | $3,809 | $24,493 |
| 2022 | $3,530 | $26,478 | $4,139 | $22,339 |
| 2021 | $3,391 | $25,677 | $4,014 | $21,663 |
| 2020 | $3,244 | $24,900 | $3,892 | $21,008 |
| 2019 | $3,308 | $24,146 | $3,775 | $20,371 |
| 2018 | $3,216 | $23,413 | $3,660 | $19,753 |
| 2017 | $3,112 | $23,702 | $3,705 | $19,997 |
| 2016 | $2,955 | $23,012 | $3,597 | $19,415 |
| 2015 | $2,961 | $23,012 | $3,597 | $19,415 |
| 2014 | $2,932 | $23,012 | $3,597 | $19,415 |
Source: Public Records
Map
Nearby Homes
- 5524 E 73rd St
- 7303 S Fulton Place
- 7426 S Fulton Place
- 7323 S Canton Ave
- 7366 S Darlington Ave
- 5607 E 76th St
- 7329 S Yale Ave Unit 107
- 7403 S Yale Ave Unit 122
- 7325 S Yale Ave Unit 115
- 7455 S Yale Ave Unit 237
- 7455 S Yale Ave Unit 138
- 7321 S Yale Ave Unit 219
- 7447 S Yale Ave Unit 126
- 7646 S Fulton Ave
- 7724 S Erie Ave
- 0 S Braden Ave Unit 2507852
- 7459 S Vandalia Ave Unit 1201
- 7436 S Winston Place Unit 502
- 4411 E 72nd Place
- 5819 E 78th Place
- 7319 S Fulton Ave
- 5514 E 73rd St
- 7306 S Fulton Place
- 7325 S Fulton Ave
- 7312 S Fulton Place
- 7314 S Fulton Ave
- 7306 S Fulton Ave
- 7320 S Fulton Ave
- 7320 S Fulton Place
- 7328 S Fulton Ave
- 7333 S Fulton Ave
- 5511 E 73rd St
- 7311 S Erie Ave
- 5503 E 73rd St
- 7305 S Erie Ave
- 5519 E 73rd St
- 7328 S Fulton Place
- 5421 E 73rd St
- 7319 S Erie Ave
- 7334 S Fulton Ave