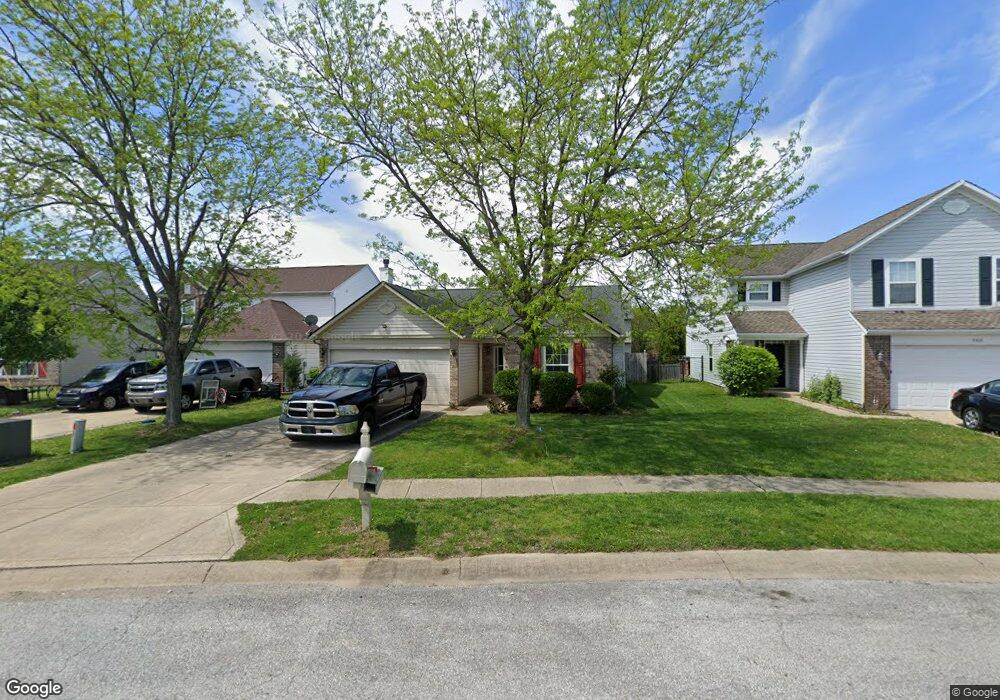
7316 Atmore Dr Indianapolis, IN 46217
Linden Wood NeighborhoodEstimated Value: $214,642 - $252,000
3
Beds
2
Baths
1,200
Sq Ft
$196/Sq Ft
Est. Value
About This Home
This home is located at 7316 Atmore Dr, Indianapolis, IN 46217 and is currently estimated at $235,411, approximately $196 per square foot. 7316 Atmore Dr is a home located in Marion County with nearby schools including William Henry Burkhart Elementary School, Perry Meridian 6th Grade Academy, and Perry Meridian Middle School.
Ownership History
Date
Name
Owned For
Owner Type
Purchase Details
Closed on
Dec 4, 2023
Sold by
Mang That L
Bought by
Mang Biakrem
Current Estimated Value
Purchase Details
Closed on
Oct 27, 2009
Sold by
Stephenson Jeff D
Bought by
Mang That L
Home Financials for this Owner
Home Financials are based on the most recent Mortgage that was taken out on this home.
Original Mortgage
$108,007
Interest Rate
5.11%
Mortgage Type
FHA
Purchase Details
Closed on
Mar 10, 2006
Sold by
Fannie Mae
Bought by
Stephenson Jeff D
Home Financials for this Owner
Home Financials are based on the most recent Mortgage that was taken out on this home.
Original Mortgage
$96,387
Interest Rate
6.37%
Mortgage Type
FHA
Purchase Details
Closed on
Oct 3, 2005
Sold by
Jurgensen James R and Estate Of Sandra C Jurgensen
Bought by
Not Provided
Create a Home Valuation Report for This Property
The Home Valuation Report is an in-depth analysis detailing your home's value as well as a comparison with similar homes in the area
Home Values in the Area
Average Home Value in this Area
Purchase History
We collect this data history from publicly available records. To have your information removed, we recommend requesting removal directly through your county’s website.
| Date | Buyer | Sale Price | Title Company |
|---|---|---|---|
| Mang Biakrem | -- | Indiana Title | |
| Mang That L | -- | Chicago Title Insurance Co | |
| Stephenson Jeff D | -- | None Available | |
| Not Provided | -- | None Available |
Source: Public Records
Mortgage History
We collect this data history from publicly available records. To have your information removed, we recommend requesting removal directly through your county’s website.
| Date | Status | Borrower | Loan Amount |
|---|---|---|---|
| Previous Owner | Mang That L | $108,007 | |
| Previous Owner | Stephenson Jeff D | $96,387 |
Source: Public Records
Tax History
| Year | Tax Paid | Tax Assessment Tax Assessment Total Assessment is a certain percentage of the fair market value that is determined by local assessors to be the total taxable value of land and additions on the property. | Land | Improvement |
|---|---|---|---|---|
| 2025 | $2,396 | $200,900 | $21,200 | $179,700 |
| 2024 | $2,421 | $190,900 | $21,200 | $169,700 |
| 2023 | $2,421 | $189,800 | $21,200 | $168,600 |
| 2022 | $2,372 | $177,100 | $21,200 | $155,900 |
| 2021 | $1,849 | $141,100 | $21,200 | $119,900 |
| 2020 | $1,628 | $128,600 | $21,200 | $107,400 |
| 2019 | $1,650 | $129,800 | $19,400 | $110,400 |
| 2018 | $1,355 | $114,100 | $19,400 | $94,700 |
| 2017 | $1,288 | $111,000 | $19,400 | $91,600 |
| 2016 | $1,199 | $105,700 | $19,400 | $86,300 |
| 2014 | $953 | $101,500 | $19,400 | $82,100 |
| 2013 | $968 | $98,700 | $19,400 | $79,300 |
Source: Public Records
Map
Nearby Homes
- 7207 Brant Pointe Cir
- 937 Barnwell Way
- 7308 Moultrie Dr
- 7151 Brant Pointe Cir
- 910 Angus Way
- 7427 Oak Knoll Dr
- 933 Amesbury Ct
- 919 Amesbury Ct
- 1146 Nanwich Ct
- 7451 Oak Knoll Dr
- 1222 Estuary Dr
- 953 Beal Way
- 1234 Estuary Dr
- 1215 Tommy Lee Ct
- 922 Beal Way
- 916 Beal Way
- 1076 W Southport Rd
- 6943 Arjay Dr
- 7412 Lattice Dr
- 7603 Shannon Lakes Way
- 7322 Atmore Dr
- 7310 Atmore Dr
- 7304 Atmore Dr
- 7307 Glenwick Blvd
- 7326 Atmore Dr
- 7313 Glenwick Blvd
- 7251 Glenwick Blvd
- 7252 Atmore Dr
- 7319 Atmore Dr
- 7309 Atmore Dr
- 7319 Glenwick Blvd
- 7245 Glenwick Blvd
- 961 Atmore Place
- 7248 Atmore Dr
- 7303 Atmore Dr
- 7246 Atmore Dr
- 957 Atmore Place
- 7325 Glenwick Blvd
- 7239 Glenwick Blvd
- 942 Atmore Place
Your Personal Tour Guide
Ask me questions while you tour the home.