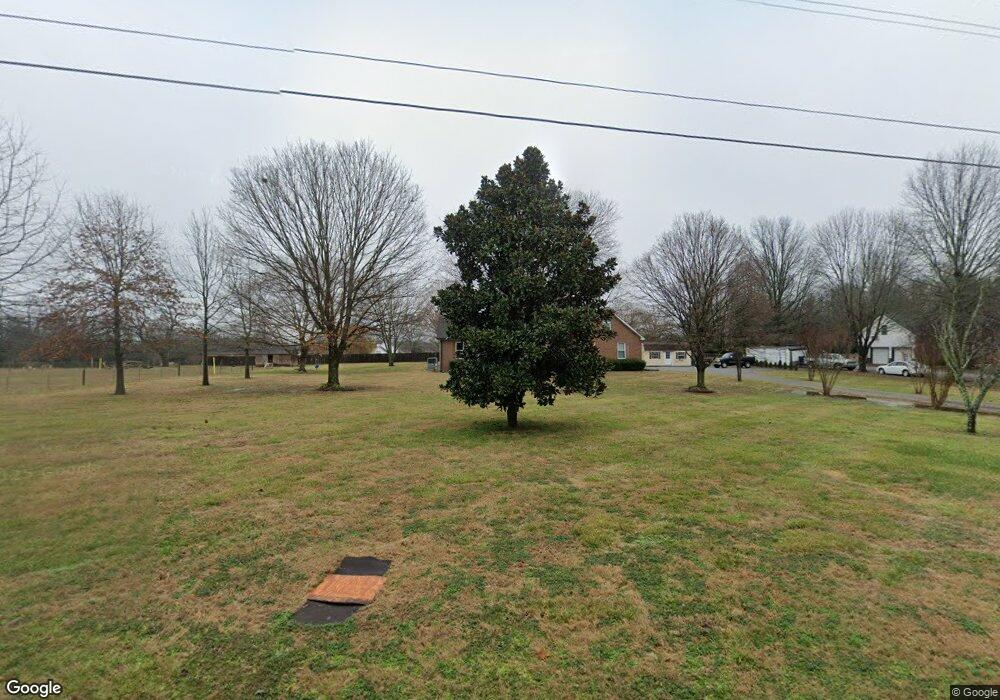
7316 Chowning Rd Springfield, TN 37172
Estimated Value: $377,903 - $424,000
Studio
2
Baths
1,533
Sq Ft
$259/Sq Ft
Est. Value
About This Home
This home is located at 7316 Chowning Rd, Springfield, TN 37172 and is currently estimated at $397,476, approximately $259 per square foot. 7316 Chowning Rd is a home located in Robertson County with nearby schools including East Robertson Elementary School, East Robertson High School, and Dayspring Academy.
Ownership History
Date
Name
Owned For
Owner Type
Purchase Details
Closed on
Dec 11, 2020
Sold by
Weaver James B
Bought by
Weaver Ryan J and Weaver Lacey P
Current Estimated Value
Home Financials for this Owner
Home Financials are based on the most recent Mortgage that was taken out on this home.
Original Mortgage
$247,500
Outstanding Balance
$219,332
Interest Rate
2.7%
Mortgage Type
New Conventional
Estimated Equity
$178,144
Purchase Details
Closed on
Apr 8, 2011
Sold by
Sumerel Suzanne
Bought by
Weaver James B
Home Financials for this Owner
Home Financials are based on the most recent Mortgage that was taken out on this home.
Original Mortgage
$172,020
Interest Rate
4.85%
Mortgage Type
Commercial
Purchase Details
Closed on
Aug 28, 2003
Sold by
Mark Stribling
Bought by
Desmond Sumerel
Home Financials for this Owner
Home Financials are based on the most recent Mortgage that was taken out on this home.
Original Mortgage
$164,200
Interest Rate
5.24%
Purchase Details
Closed on
Oct 31, 1995
Bought by
Greer Sue Etvir Greer Joel
Create a Home Valuation Report for This Property
The Home Valuation Report is an in-depth analysis detailing your home's value as well as a comparison with similar homes in the area
Home Values in the Area
Average Home Value in this Area
Purchase History
| Date | Buyer | Sale Price | Title Company |
|---|---|---|---|
| Weaver Ryan J | $275,000 | Highland Title Llc | |
| Weaver James B | $166,000 | -- | |
| Desmond Sumerel | $159,900 | -- | |
| Greer Sue Etvir Greer Joel | $14,600 | -- |
Source: Public Records
Mortgage History
| Date | Status | Borrower | Loan Amount |
|---|---|---|---|
| Open | Weaver Ryan J | $247,500 | |
| Previous Owner | Greer Sue Etvir Greer Joel | $190,327 | |
| Previous Owner | Weaver James B | $172,020 | |
| Previous Owner | Greer Sue Etvir Greer Joel | $164,200 |
Source: Public Records
Tax History
| Year | Tax Paid | Tax Assessment Tax Assessment Total Assessment is a certain percentage of the fair market value that is determined by local assessors to be the total taxable value of land and additions on the property. | Land | Improvement |
|---|---|---|---|---|
| 2025 | $1,310 | $72,775 | $14,100 | $58,675 |
| 2024 | $1,310 | $72,775 | $14,100 | $58,675 |
| 2023 | $1,310 | $72,775 | $14,100 | $58,675 |
| 2022 | $1,341 | $52,075 | $6,825 | $45,250 |
| 2021 | $1,341 | $52,075 | $6,825 | $45,250 |
| 2020 | $1,341 | $52,075 | $6,825 | $45,250 |
| 2019 | $1,341 | $52,075 | $6,825 | $45,250 |
| 2018 | $1,341 | $52,075 | $6,825 | $45,250 |
| 2017 | $1,115 | $36,150 | $5,850 | $30,300 |
| 2016 | $1,115 | $36,150 | $5,850 | $30,300 |
| 2015 | $1,070 | $36,150 | $5,850 | $30,300 |
| 2014 | $1,070 | $36,150 | $5,850 | $30,300 |
Source: Public Records
Map
Nearby Homes
- 7956 Bethlehem Rd
- 116 Pennsylvania Ave
- 8903 Covington Rd
- 8927 Covington Rd
- 6719 Japonica Ln
- 102 Pennsylvania Ave
- 6685 Japonica Ln
- 6698 Japonica Ln
- 6675 Japonica Ln
- 6623 Japonica Ln
- 6617 Japonica Ln
- 6615 Japonica Ln
- 6605 Japonica Ln
- Jennings Plan at Legacy Farms
- Clifton Plan at Legacy Farms
- Astor Plan at Legacy Farms
- Bowen Plan at Legacy Farms
- Bristol Plan at Legacy Farms
- Desmond Plan at Legacy Farms
- EDMON Plan at Legacy Farms
- 7324 Chowning Rd
- 7328 Chowning Rd
- 7291 W Cook Rd
- 7283 W Cook Rd
- 7334 Chowning Rd
- 7301 W Cook Rd
- 7297 W Cook Rd
- 7305 W Cook Rd
- 7339 Chowning Rd
- 7350 Chowning Rd
- 7313 W Cook Rd
- 7356 Chowning Rd
- 7319 W Cook Rd
- 7336 Chowning Rd
- 7355 Chowning Rd
- 7375 Chowning Rd
- 7309 W Cook Rd
- 7417 Chowning Rd
- 7325 W Cook Rd
- 7360 Chowning Rd