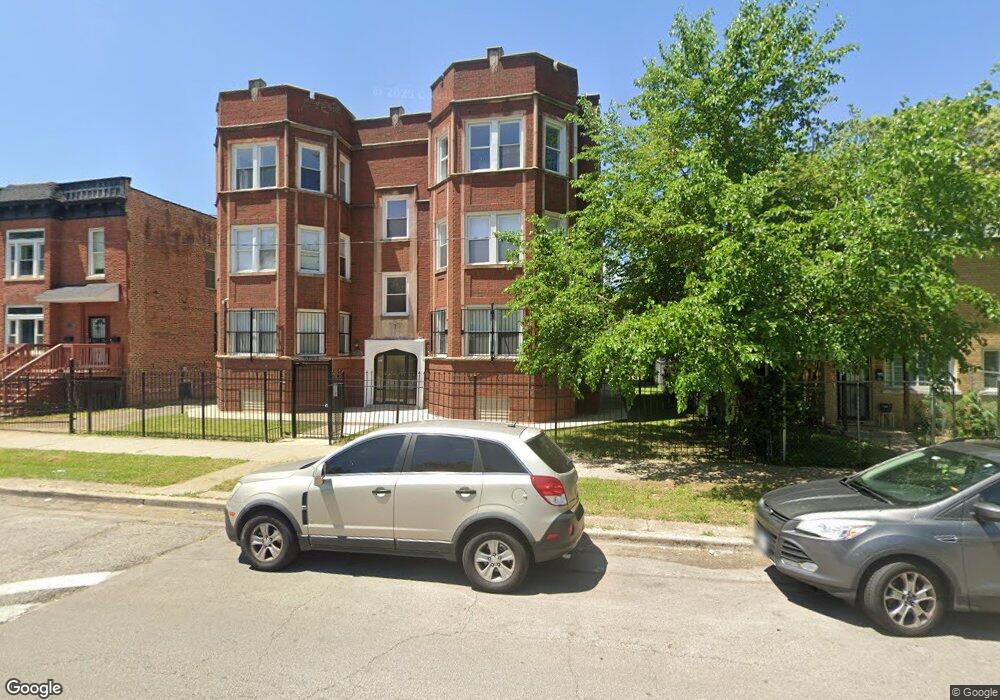
7316 S Dorchester Ave Unit 7316 Chicago, IL 60619
Grand Crossing NeighborhoodEstimated Value: $96,930 - $288,000
3
Beds
1
Bath
1,500
Sq Ft
$102/Sq Ft
Est. Value
About This Home
This home is located at 7316 S Dorchester Ave Unit 7316, Chicago, IL 60619 and is currently estimated at $152,483, approximately $101 per square foot. 7316 S Dorchester Ave Unit 7316 is a home located in Cook County with nearby schools including Madison Elementary School, Gary Comer College Prep Middle School, and St Paul Lutheran School.
Ownership History
Date
Name
Owned For
Owner Type
Purchase Details
Closed on
Oct 28, 2020
Sold by
Japanwala Mumtaz
Bought by
Dorchester Four Llc
Current Estimated Value
Purchase Details
Closed on
Mar 29, 2012
Sold by
7318 S Dorchester Llc
Bought by
Japanwala Mumtaz
Purchase Details
Closed on
Jul 24, 2007
Sold by
Dieffenbach Robert
Bought by
7318 South Dorchester Llc
Purchase Details
Closed on
Jul 17, 2007
Sold by
Underwood Carol Anne
Bought by
7318 South Dorchester Llc
Purchase Details
Closed on
Apr 29, 2004
Sold by
Synovation Development Llc
Bought by
Dieffenbach Robert
Home Financials for this Owner
Home Financials are based on the most recent Mortgage that was taken out on this home.
Original Mortgage
$183,200
Interest Rate
4.5%
Mortgage Type
Purchase Money Mortgage
Create a Home Valuation Report for This Property
The Home Valuation Report is an in-depth analysis detailing your home's value as well as a comparison with similar homes in the area
Home Values in the Area
Average Home Value in this Area
Purchase History
| Date | Buyer | Sale Price | Title Company |
|---|---|---|---|
| Dorchester Four Llc | -- | Chicago Title Insurance Co | |
| Japanwala Mumtaz | $120,000 | Fidelity Natl Title Ins Co | |
| 7318 South Dorchester Llc | $350,000 | Multiple | |
| 7318 South Dorchester Llc | -- | Multiple | |
| Dieffenbach Robert | $229,000 | Pntn | |
| Synovation Development Llc | $485,000 | Pntn |
Source: Public Records
Mortgage History
| Date | Status | Borrower | Loan Amount |
|---|---|---|---|
| Previous Owner | Dieffenbach Robert | $183,200 |
Source: Public Records
Tax History Compared to Growth
Tax History
| Year | Tax Paid | Tax Assessment Tax Assessment Total Assessment is a certain percentage of the fair market value that is determined by local assessors to be the total taxable value of land and additions on the property. | Land | Improvement |
|---|---|---|---|---|
| 2024 | $212 | $5,787 | $1,399 | $4,388 |
| 2023 | $205 | $1,000 | $500 | $500 |
| 2022 | $205 | $1,000 | $500 | $500 |
| 2021 | $201 | $999 | $500 | $499 |
| 2020 | $1,530 | $6,866 | $1,709 | $5,157 |
| 2019 | $461 | $2,294 | $1,709 | $585 |
| 2018 | $453 | $2,294 | $1,709 | $585 |
| 2017 | $509 | $2,366 | $1,554 | $812 |
| 2016 | $474 | $2,366 | $1,554 | $812 |
| 2015 | $434 | $2,366 | $1,554 | $812 |
| 2014 | $3,327 | $17,931 | $1,282 | $16,649 |
| 2013 | $617 | $3,395 | $1,282 | $2,113 |
Source: Public Records
Map
Nearby Homes
- 7300 S Dorchester Ave Unit B
- 7327 S Kenwood Ave
- 7343 S Kenwood Ave
- 7316 S Dante Ave
- 1336 E 73rd St
- 7356 S Kenwood Ave
- 7319 S Dante Ave
- 7421 S Dante Ave
- 7431 S Kimbark Ave
- 7431 S Dante Ave
- 7422 S Kimbark Ave
- 1412 E 75th St
- 1310 E 72nd St
- 1403 E 71st Place Unit 2
- 1526 E 72nd Place
- 7225 S Woodlawn Ave
- 7316 S Woodlawn Ave
- 7514 S Dante Ave
- 1257 E 75th St
- 7523 S Kimbark Ave
- 7316 S Dorchester Ave Unit 7316
- 7316 S Dorchester Ave Unit 7316
- 7316 S Dorchester Ave Unit 3
- 7316 S Dorchester Ave Unit 1
- 7316 S Dorchester Ave Unit 2S
- 7318 S Dorchester Ave Unit 7318
- 7318 S Dorchester Ave Unit 7318
- 7318 S Dorchester Ave Unit 7318
- 7318 S Dorchester Ave Unit 2
- 7318 S Dorchester Ave Unit 3S
- 7310 S Dorchester Ave
- 7310 S Dorchester Ave Unit A
- 7322 S Dorchester Ave
- 7308 S Dorchester Ave
- 7308 S Dorchester Ave
- 7308 S Dorchester Ave Unit A
- 7306 S Dorchester Ave
- 7306 S Dorchester Ave
- 7328 S Dorchester Ave Unit 2
- 7304 S Dorchester Ave