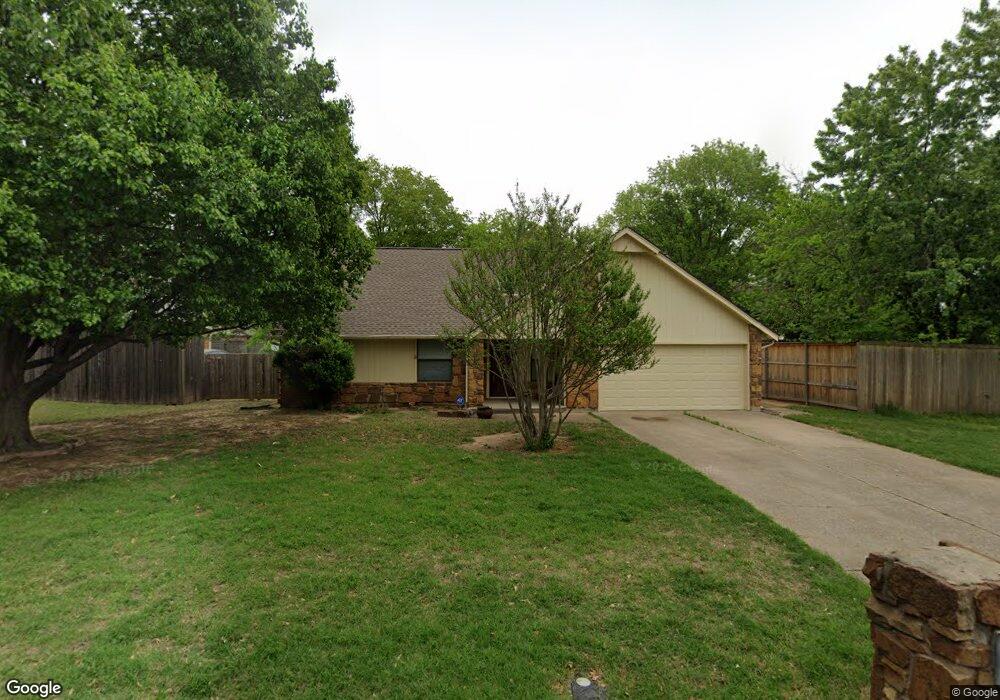
7317 E 65th Place Tulsa, OK 74133
Shadow Mountain NeighborhoodEstimated Value: $286,976 - $316,000
4
Beds
3
Baths
2,394
Sq Ft
$127/Sq Ft
Est. Value
About This Home
This home is located at 7317 E 65th Place, Tulsa, OK 74133 and is currently estimated at $303,244, approximately $126 per square foot. 7317 E 65th Place is a home located in Tulsa County with nearby schools including Grissom Elementary School, Memorial Middle School, and Memorial High School.
Ownership History
Date
Name
Owned For
Owner Type
Purchase Details
Closed on
Aug 13, 2018
Sold by
Parks Rebecca Victoria and Howell Jay Thomas
Bought by
Heritag Parks Rebecca Victoria and Rebecca Victoria Parks Heritage Trust
Current Estimated Value
Home Financials for this Owner
Home Financials are based on the most recent Mortgage that was taken out on this home.
Original Mortgage
$160,000
Outstanding Balance
$117,686
Interest Rate
4.5%
Mortgage Type
Credit Line Revolving
Estimated Equity
$185,558
Purchase Details
Closed on
Mar 13, 2001
Sold by
Ty Kait Inc
Bought by
Crittenden Kenneth W and Crittenden Katherine S
Home Financials for this Owner
Home Financials are based on the most recent Mortgage that was taken out on this home.
Original Mortgage
$135,266
Interest Rate
7.1%
Mortgage Type
Purchase Money Mortgage
Purchase Details
Closed on
Mar 23, 2000
Sold by
Taylor James S and Taylor Tanya M
Bought by
Ty Kait Inc
Purchase Details
Closed on
Jul 1, 1995
Purchase Details
Closed on
Sep 1, 1987
Create a Home Valuation Report for This Property
The Home Valuation Report is an in-depth analysis detailing your home's value as well as a comparison with similar homes in the area
Home Values in the Area
Average Home Value in this Area
Purchase History
| Date | Buyer | Sale Price | Title Company |
|---|---|---|---|
| Heritag Parks Rebecca Victoria | -- | None Available | |
| Crittenden Kenneth W | $144,000 | -- | |
| Ty Kait Inc | -- | -- | |
| -- | $110,000 | -- | |
| -- | $114,000 | -- |
Source: Public Records
Mortgage History
| Date | Status | Borrower | Loan Amount |
|---|---|---|---|
| Open | Heritag Parks Rebecca Victoria | $160,000 | |
| Previous Owner | Crittenden Kenneth W | $135,266 |
Source: Public Records
Tax History
| Year | Tax Paid | Tax Assessment Tax Assessment Total Assessment is a certain percentage of the fair market value that is determined by local assessors to be the total taxable value of land and additions on the property. | Land | Improvement |
|---|---|---|---|---|
| 2025 | $3,547 | $26,469 | $3,322 | $23,147 |
| 2024 | $3,047 | $25,209 | $3,676 | $21,533 |
| 2023 | $3,047 | $24,008 | $3,235 | $20,773 |
| 2022 | $3,048 | $22,865 | $3,927 | $18,938 |
| 2021 | $2,876 | $21,776 | $3,740 | $18,036 |
| 2020 | $2,837 | $21,776 | $3,740 | $18,036 |
| 2019 | $2,892 | $21,107 | $3,625 | $17,482 |
| 2018 | $2,761 | $20,101 | $3,869 | $16,232 |
| 2017 | $2,624 | $19,144 | $3,685 | $15,459 |
| 2016 | $2,570 | $19,144 | $3,685 | $15,459 |
| 2015 | $2,548 | $19,144 | $3,685 | $15,459 |
| 2014 | $2,403 | $18,040 | $3,685 | $14,355 |
Source: Public Records
Map
Nearby Homes
- 7505 E 65th St
- 7545 E 65th Place
- 7021 E 66th Place
- 7203 E 67th St
- 6366 S 80th East Ave Unit E
- 6307 S 72nd Ave E
- 7021 E 67th St
- 7029 E 63rd St
- 7322 E 62nd Place
- 6364 S 80th East Ave Unit G
- 6380 S 80th East Ave Unit 30
- 6376 S 80th East Ave Unit 41A
- 7905 E 66th St Unit 37
- 6314 S 70th East Ave
- 6738 S 78th East Ave
- 6803 S 77th East Ave
- 6760 S 78th East Ave
- 6903 E 63rd St
- 6506 S Memorial Dr Unit 13
- 6751 S 71st East Ave
- 7323 E 65th St
- 7311 E 65th Place
- 7316 E 65th St
- 7322 E 65th St
- 4317 E 134th St
- 7310 E 65th St
- 7318 E 65th Place
- 7310 E 65th Place
- 7326 E 65th Place
- 7227 E 65th Place
- 7304 E 65th St
- 7303 E 65th St
- 7230 E 65th Place
- 7405 E 65th Place
- 7404 E 65th Place
- 6507 S 74th East Ave
- 7317 E 65th St
- 7236 E 65th St
- 7223 E 66th St
- 7311 E 66th St
Your Personal Tour Guide
Ask me questions while you tour the home.