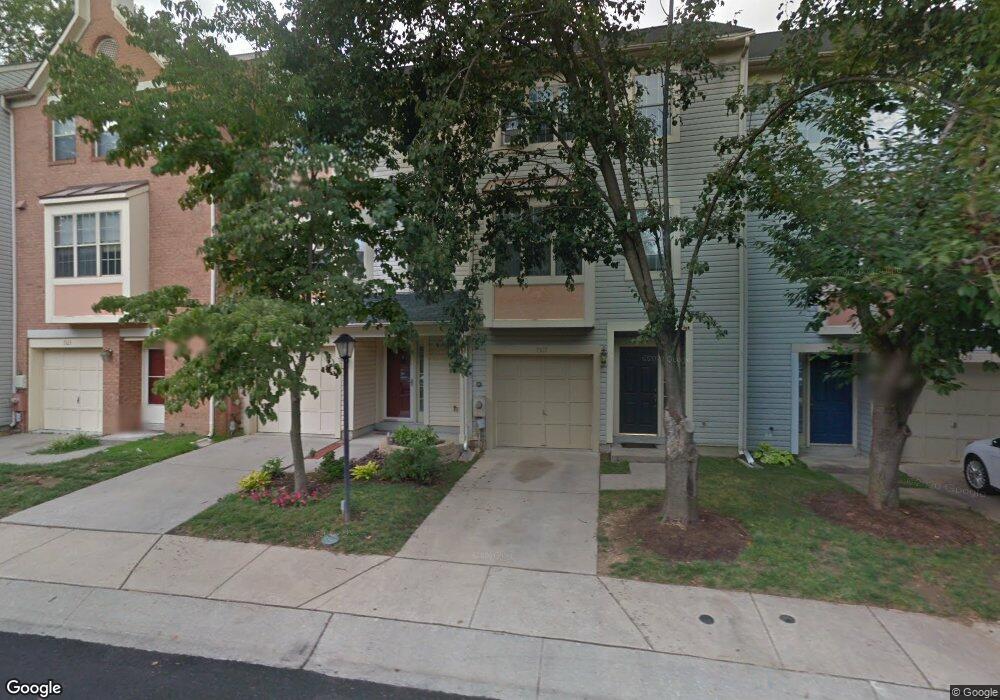
7317 Eden Brook Dr Unit H307 Columbia, MD 21046
Kings Contrivance NeighborhoodEstimated Value: $245,049 - $304,000
2
Beds
2
Baths
1,007
Sq Ft
$263/Sq Ft
Est. Value
About This Home
This home is located at 7317 Eden Brook Dr Unit H307, Columbia, MD 21046 and is currently estimated at $265,012, approximately $263 per square foot. 7317 Eden Brook Dr Unit H307 is a home located in Howard County with nearby schools including Hammond Elementary School, Hammond Middle School, and Hammond High School.
Ownership History
Date
Name
Owned For
Owner Type
Purchase Details
Closed on
Mar 5, 2009
Sold by
Rosa Elayne
Bought by
Lederman Kristin A
Current Estimated Value
Purchase Details
Closed on
Jun 1, 2006
Sold by
Koung Devi H
Bought by
Elayne Rosa and Felippe Boeira Felippe
Purchase Details
Closed on
May 11, 2006
Sold by
Koung Devi H
Bought by
Elayne Rosa and Felippe Boeira Felippe
Purchase Details
Closed on
Dec 19, 2005
Sold by
Soo Sub Paul Duck
Bought by
Koung Devi H
Purchase Details
Closed on
Dec 15, 2005
Sold by
Sub Paul Duck Soo
Bought by
Koung Devi H
Purchase Details
Closed on
May 6, 2002
Sold by
Childers John C
Bought by
Sub Paul Duck Soo and Suh Helen Young Hwa
Purchase Details
Closed on
Mar 5, 1999
Sold by
Wieland Ward Melissa Jo
Bought by
Childers John C and Childers Linda F
Create a Home Valuation Report for This Property
The Home Valuation Report is an in-depth analysis detailing your home's value as well as a comparison with similar homes in the area
Home Values in the Area
Average Home Value in this Area
Purchase History
| Date | Buyer | Sale Price | Title Company |
|---|---|---|---|
| Lederman Kristin A | $181,000 | -- | |
| Elayne Rosa | $250,400 | -- | |
| Elayne Rosa | $250,400 | -- | |
| Koung Devi H | $220,000 | -- | |
| Koung Devi H | $220,000 | -- | |
| Sub Paul Duck Soo | $121,900 | -- | |
| Childers John C | $93,000 | -- |
Source: Public Records
Mortgage History
| Date | Status | Borrower | Loan Amount |
|---|---|---|---|
| Closed | Childers John C | -- |
Source: Public Records
Tax History Compared to Growth
Tax History
| Year | Tax Paid | Tax Assessment Tax Assessment Total Assessment is a certain percentage of the fair market value that is determined by local assessors to be the total taxable value of land and additions on the property. | Land | Improvement |
|---|---|---|---|---|
| 2025 | $3,393 | $214,000 | $0 | $0 |
| 2024 | $3,393 | $207,200 | $0 | $0 |
| 2023 | $3,245 | $200,400 | $60,100 | $140,300 |
| 2022 | $3,131 | $195,267 | $0 | $0 |
| 2021 | $3,057 | $190,133 | $0 | $0 |
| 2020 | $2,983 | $185,000 | $56,000 | $129,000 |
| 2019 | $2,840 | $175,000 | $0 | $0 |
| 2018 | $2,557 | $165,000 | $0 | $0 |
| 2017 | $2,411 | $155,000 | $0 | $0 |
| 2016 | $527 | $155,000 | $0 | $0 |
| 2015 | $527 | $155,000 | $0 | $0 |
| 2014 | $527 | $155,000 | $0 | $0 |
Source: Public Records
Map
Nearby Homes
- 7505 Weather Worn Way Unit E
- 7505 Weather Worn Way Unit A
- 7573 Weather Worn Way Unit D
- 7459 Setting Sun Way
- 7224 Cadence Ct
- 8617 Sassafras Ct
- 7136 Fountain Rock Way
- 8871 Stonebrook Ln
- 8969 Skyrock Ct
- 7641 Woodstream Way
- 10145 Goodin Cir
- 7508 Rain Flower Way
- 7520 Summer Blossom Ln
- 10153 Cape Ann Dr
- 9609 Clocktower Ln
- 10725 E Crestview Ln
- 6722 Seneca Dr
- 9453 Clocktower Ln
- 9469 Clocktower Ln
- 9734 Polished Stone
- 7317 Eden Brook Dr Unit H601
- 7317 Eden Brook Dr Unit H702
- 7317 Eden Brook Dr Unit H201
- 7317 Eden Brook Dr Unit H405
- 7317 Eden Brook Dr Unit H505
- 7317 Eden Brook Dr Unit H402
- 7317 Eden Brook Dr Unit H604
- 7317 Eden Brook Dr Unit UT305
- 7317 Eden Brook Dr Unit H705
- 7317 Eden Brook Dr Unit H102
- 7317 Eden Brook Dr Unit H301
- 7317 Eden Brook Dr Unit H304
- 7317 Eden Brook Dr Unit H506
- 7317 Eden Brook Dr Unit 603
- 7317 Eden Brook Dr Unit H501
- 7317 Eden Brook Dr Unit H101
- 7317 Eden Brook Dr Unit H306
- 7317 Eden Brook Dr Unit 602
- 7317 Eden Brook Dr Unit H707
- 7317 Eden Brook Dr Unit H202