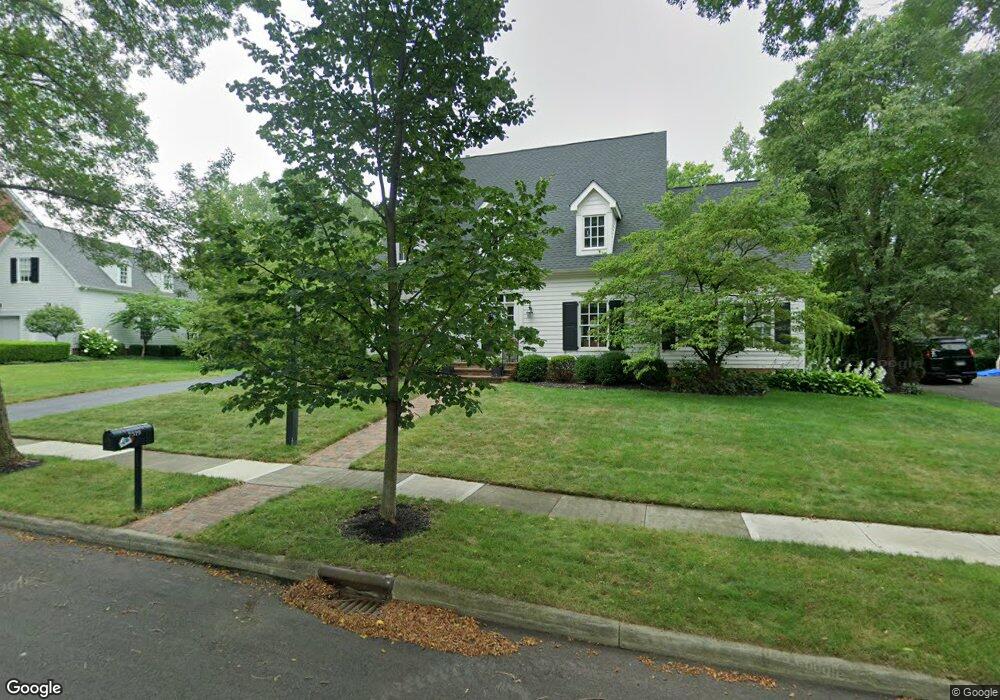
7319 Berkley Square S New Albany, OH 43054
Estimated Value: $952,263 - $1,410,000
6
Beds
5
Baths
3,378
Sq Ft
$332/Sq Ft
Est. Value
About This Home
This home is located at 7319 Berkley Square S, New Albany, OH 43054 and is currently estimated at $1,121,816, approximately $332 per square foot. 7319 Berkley Square S is a home located in Franklin County with nearby schools including New Albany Primary School, New Albany Intermediate School, and New Albany Middle School.
Ownership History
Date
Name
Owned For
Owner Type
Purchase Details
Closed on
Jun 8, 2000
Sold by
Stover John W and Stover Patricia L
Bought by
Sypek Paul F and Sypek Amy E
Current Estimated Value
Home Financials for this Owner
Home Financials are based on the most recent Mortgage that was taken out on this home.
Original Mortgage
$300,000
Outstanding Balance
$106,364
Interest Rate
8.3%
Estimated Equity
$1,015,452
Purchase Details
Closed on
Jul 31, 1997
Sold by
Haven Inc
Bought by
Stover John W and Stover Patricia L
Home Financials for this Owner
Home Financials are based on the most recent Mortgage that was taken out on this home.
Original Mortgage
$345,000
Interest Rate
7.71%
Purchase Details
Closed on
Feb 27, 1996
Sold by
New Albany Co Ltd Ptns
Bought by
Haven Inc
Home Financials for this Owner
Home Financials are based on the most recent Mortgage that was taken out on this home.
Original Mortgage
$314,200
Interest Rate
7.16%
Mortgage Type
New Conventional
Purchase Details
Closed on
Dec 28, 1995
Sold by
New Albany Co Ltd Ptns
Bought by
Haven Inc
Create a Home Valuation Report for This Property
The Home Valuation Report is an in-depth analysis detailing your home's value as well as a comparison with similar homes in the area
Home Values in the Area
Average Home Value in this Area
Purchase History
| Date | Buyer | Sale Price | Title Company |
|---|---|---|---|
| Sypek Paul F | $525,000 | Stewart Title Agency Of Colu | |
| Stover John W | $439,000 | -- | |
| Haven Inc | $75,000 | -- | |
| Haven Inc | $75,000 | -- |
Source: Public Records
Mortgage History
| Date | Status | Borrower | Loan Amount |
|---|---|---|---|
| Open | Sypek Paul F | $300,000 | |
| Closed | Stover John W | $345,000 | |
| Closed | Haven Inc | $314,200 |
Source: Public Records
Tax History Compared to Growth
Tax History
| Year | Tax Paid | Tax Assessment Tax Assessment Total Assessment is a certain percentage of the fair market value that is determined by local assessors to be the total taxable value of land and additions on the property. | Land | Improvement |
|---|---|---|---|---|
| 2024 | $15,647 | $251,510 | $77,000 | $174,510 |
| 2023 | $14,809 | $251,510 | $77,000 | $174,510 |
| 2022 | $14,786 | $191,070 | $55,130 | $135,940 |
| 2021 | $14,231 | $191,070 | $55,130 | $135,940 |
| 2020 | $14,216 | $191,070 | $55,130 | $135,940 |
| 2019 | $14,821 | $182,180 | $52,500 | $129,680 |
| 2018 | $14,889 | $182,180 | $52,500 | $129,680 |
| 2017 | $14,977 | $182,180 | $52,500 | $129,680 |
| 2016 | $15,104 | $171,120 | $50,370 | $120,750 |
| 2015 | $15,133 | $171,120 | $50,370 | $120,750 |
| 2014 | $14,188 | $171,120 | $50,370 | $120,750 |
| 2013 | $7,301 | $162,960 | $47,950 | $115,010 |
Source: Public Records
Map
Nearby Homes
- 3637 Head of Pond Rd
- 1221 Belcross Dr
- 1497 Harrison Pond Dr
- 3377 Abberley Dr Unit LOT 902
- 6590 Wheatly Rd
- 6544 Wheatly Rd Unit LOT 702
- 6540 Wheatly Rd Unit LOT 701
- 6526 Wheatly Rd Unit LOT 802
- 6531 Wheatly Rd Unit LOT 102
- 6522 Wheatly Rd Unit LOT 801
- 6532 Wheatly Rd Unit LOT 804
- 6528 Wheatly Rd Unit LOT 803
- 1210 Whispering Meadow Ct
- 3292 Strickland Dr Unit 66
- 7747 Sutton Place
- 1060 Challis Springs Dr
- 3920 Lewis Link Dr
- 4444 Shull Rd
- 4636 Collingville Way Unit 22
- 7030 Hanby's Loop
- 2334 Berkley Square S
- 7333 Berkley Square S
- 7301 Berkley Square S
- 7314 James River Rd E
- 7300 James River Rd E
- 7318 Berkley Square S
- 7290 Berkley Square S
- 7334 Berkley Square S
- 7330 James River Rd E
- 7284 James River Rd E
- 3575 Head of Pond Rd
- 3561 Head of Pond Rd
- 3561 Head of Pond Dr
- 3601 Head of Pond Rd
- 7285 Berkley Square S
- 7348 James River Rd E
- 7331 Berkley Square N
- 7345 Berkley Square N
- 7273 Berkley Square S
- 3615 Head of Pond Rd