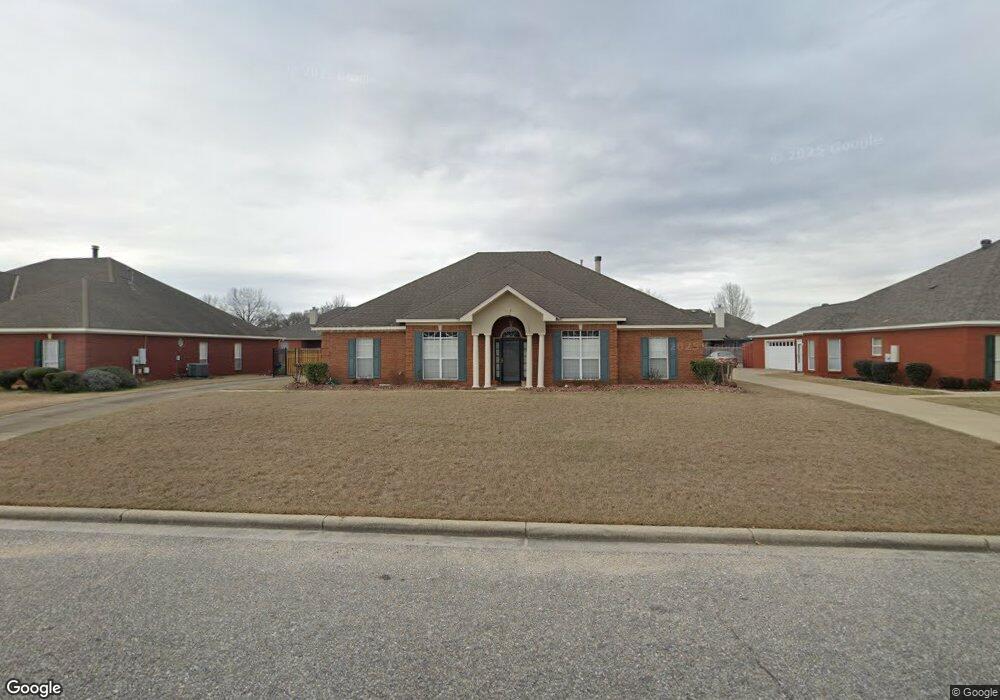
7319 Old Mitylene Rd Montgomery, AL 36117
East Montgomery NeighborhoodEstimated Value: $300,115 - $325,000
4
Beds
2
Baths
2,232
Sq Ft
$139/Sq Ft
Est. Value
About This Home
This home is located at 7319 Old Mitylene Rd, Montgomery, AL 36117 and is currently estimated at $311,029, approximately $139 per square foot. 7319 Old Mitylene Rd is a home with nearby schools including William Silas Garrett Elementary School, Johnnie R. Carr Middle School, and Park Crossing High School.
Ownership History
Date
Name
Owned For
Owner Type
Purchase Details
Closed on
Aug 24, 2020
Sold by
Thomas Jacqueline G and Gray Jacqueline
Bought by
Thomas Jacqueline Gray and Thomas Julius C
Current Estimated Value
Home Financials for this Owner
Home Financials are based on the most recent Mortgage that was taken out on this home.
Original Mortgage
$147,600
Outstanding Balance
$104,805
Interest Rate
3%
Mortgage Type
New Conventional
Estimated Equity
$206,224
Purchase Details
Closed on
Jun 26, 2000
Sold by
Designs Unlimited Inc
Bought by
Gray Jacqueline F
Home Financials for this Owner
Home Financials are based on the most recent Mortgage that was taken out on this home.
Original Mortgage
$175,000
Interest Rate
8.55%
Purchase Details
Closed on
Dec 8, 1998
Sold by
Lake Forest Partners
Bought by
Design Unlimited
Create a Home Valuation Report for This Property
The Home Valuation Report is an in-depth analysis detailing your home's value as well as a comparison with similar homes in the area
Home Values in the Area
Average Home Value in this Area
Purchase History
| Date | Buyer | Sale Price | Title Company |
|---|---|---|---|
| Thomas Jacqueline Gray | -- | Boston National Title | |
| Gray Jacqueline F | $185,000 | -- | |
| Design Unlimited | -- | -- |
Source: Public Records
Mortgage History
| Date | Status | Borrower | Loan Amount |
|---|---|---|---|
| Open | Thomas Jacqueline Gray | $147,600 | |
| Previous Owner | Gray Jacqueline F | $175,000 |
Source: Public Records
Tax History Compared to Growth
Tax History
| Year | Tax Paid | Tax Assessment Tax Assessment Total Assessment is a certain percentage of the fair market value that is determined by local assessors to be the total taxable value of land and additions on the property. | Land | Improvement |
|---|---|---|---|---|
| 2024 | $1,280 | $27,030 | $3,500 | $23,530 |
| 2023 | $1,280 | $27,300 | $3,500 | $23,800 |
| 2022 | $803 | $23,110 | $3,500 | $19,610 |
| 2021 | $741 | $21,420 | $0 | $0 |
| 2020 | $696 | $40,400 | $7,000 | $33,400 |
| 2019 | $666 | $38,760 | $7,000 | $31,760 |
| 2018 | $700 | $19,180 | $0 | $0 |
| 2017 | $680 | $39,520 | $7,000 | $32,520 |
| 2014 | $680 | $19,750 | $3,500 | $16,250 |
| 2013 | -- | $19,260 | $3,500 | $15,760 |
Source: Public Records
Map
Nearby Homes
- 530 Old Mitylene Ct
- 507 Forest Edge Place
- 531 Old Mitylene Ln
- 7282 Greenfield Rd
- 7300 Greenfield Rd
- 408 Red Oak Ct
- 7355 Old Barn Rd
- 7273 Waters Edge
- 603 Seminole Dr
- 508 Seminole Cir
- 7325 Old Forest Rd
- 200 Oldfield Dr
- 7437 Old Pump Rd
- 102 Chattahoochee Dr
- 7467 Old Pump Rd
- 51 Lake Forest Dr
- 99 Oldfield Dr
- 7927 Plum Orchard Way
- 50 Seaboard Dr
- 62 Seaboard Dr
- 7325 Old Mitylene Rd
- 7313 Old Mitylene Rd
- 7324 Anna Rose Dr
- 7330 Anna Rose Dr
- 7318 Anna Rose Dr
- 7331 Old Mitylene Rd
- 7307 Old Mitylene Rd
- 7336 Anna Rose Dr
- 7312 Anna Rose Dr
- 7337 Old Mitylene Rd
- 531 Field View Ct
- 7301 Old Mitylene Rd
- 7342 Anna Rose Dr
- 525 Old Mitylene Ct
- 7343 Old Mitylene Rd
- 7306 Anna Rose Dr
- 600 Butterfly Dr
- 7207 Greenfield Rd
- 525 Field View Ct
- 518 Old Mitylene Ct