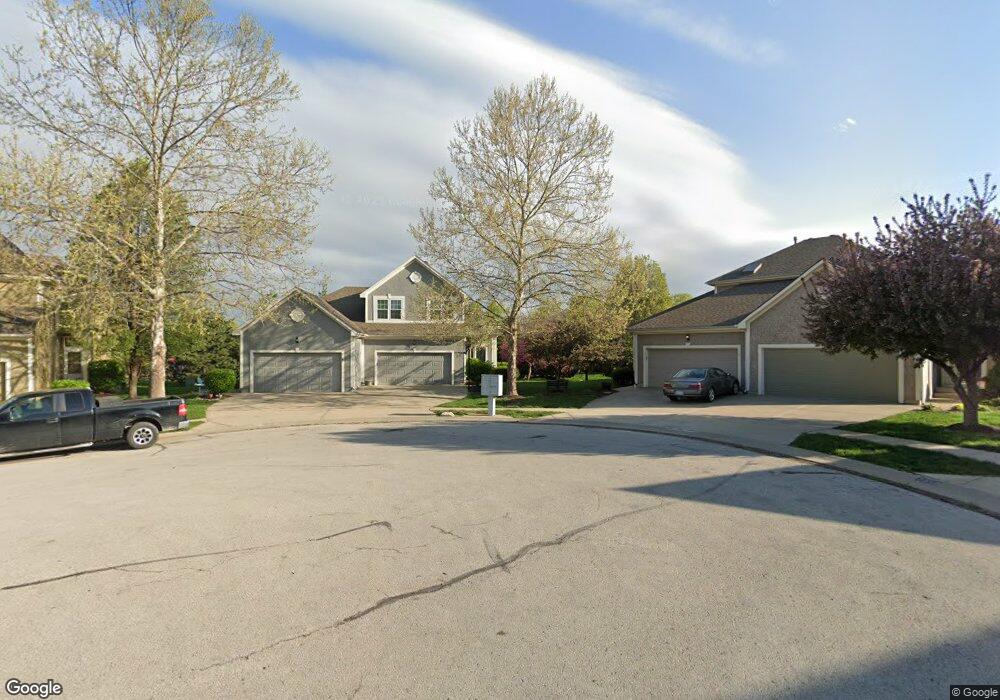
7319 Silverheel St Shawnee, KS 66227
Estimated Value: $352,000 - $375,000
3
Beds
3
Baths
1,562
Sq Ft
$234/Sq Ft
Est. Value
About This Home
This home is located at 7319 Silverheel St, Shawnee, KS 66227 and is currently estimated at $365,376, approximately $233 per square foot. 7319 Silverheel St is a home located in Johnson County with nearby schools including Horizon Elementary School, Mill Creek Middle School, and Mill Valley High School.
Ownership History
Date
Name
Owned For
Owner Type
Purchase Details
Closed on
Aug 28, 2018
Sold by
Brinkoetter Dana R and Brinkoetter Declaration Dana R
Bought by
Zubairi Muhammad Ali and Ali Ayesha
Current Estimated Value
Home Financials for this Owner
Home Financials are based on the most recent Mortgage that was taken out on this home.
Original Mortgage
$215,825
Outstanding Balance
$187,824
Interest Rate
4.5%
Mortgage Type
New Conventional
Estimated Equity
$177,552
Purchase Details
Closed on
May 18, 2001
Sold by
Brinkoetter Dana R
Bought by
Brinkoetter Dana R
Home Financials for this Owner
Home Financials are based on the most recent Mortgage that was taken out on this home.
Original Mortgage
$80,000
Interest Rate
6.99%
Purchase Details
Closed on
May 15, 2001
Sold by
M G Crocker Homes Inc
Bought by
Brinkoetter Dana R
Home Financials for this Owner
Home Financials are based on the most recent Mortgage that was taken out on this home.
Original Mortgage
$80,000
Interest Rate
6.99%
Create a Home Valuation Report for This Property
The Home Valuation Report is an in-depth analysis detailing your home's value as well as a comparison with similar homes in the area
Home Values in the Area
Average Home Value in this Area
Purchase History
| Date | Buyer | Sale Price | Title Company |
|---|---|---|---|
| Zubairi Muhammad Ali | -- | Platinum Title Llc | |
| Brinkoetter Dana R | -- | Security Land Title Company | |
| Brinkoetter Dana R | -- | Security Land Title Company |
Source: Public Records
Mortgage History
| Date | Status | Borrower | Loan Amount |
|---|---|---|---|
| Open | Zubairi Muhammad Ali | $215,825 | |
| Previous Owner | Brinkoetter Dana R | $80,000 |
Source: Public Records
Tax History Compared to Growth
Tax History
| Year | Tax Paid | Tax Assessment Tax Assessment Total Assessment is a certain percentage of the fair market value that is determined by local assessors to be the total taxable value of land and additions on the property. | Land | Improvement |
|---|---|---|---|---|
| 2024 | $3,881 | $33,638 | $5,497 | $28,141 |
| 2023 | $3,931 | $33,488 | $5,497 | $27,991 |
| 2022 | $3,721 | $31,050 | $4,393 | $26,657 |
| 2021 | $3,558 | $28,440 | $3,824 | $24,616 |
| 2020 | $3,480 | $27,566 | $3,824 | $23,742 |
| 2019 | $3,279 | $25,588 | $3,289 | $22,299 |
| 2018 | $2,798 | $21,609 | $3,289 | $18,320 |
| 2017 | $2,619 | $19,723 | $2,990 | $16,733 |
| 2016 | $2,510 | $18,665 | $2,990 | $15,675 |
| 2015 | $2,371 | $17,434 | $2,990 | $14,444 |
| 2013 | -- | $15,445 | $2,990 | $12,455 |
Source: Public Records
Map
Nearby Homes
- 22602 W 72nd Terrace
- 22500 W 75th St
- 7153 Meadow View St
- 22000 W 71st St
- 7137 Meadow View St
- 7620 Mccoy St
- 22410 W 76th St
- 22408 W 76th St
- 22404 W 76th St
- 22405 W 76th St
- 22312 W 76th St
- 7101 Meadow View St
- 22310 W 76th St
- 0 Hedge Lane Terrace
- 22309 W 76th St
- 7134 Hedge Lane Terrace
- 21910 W 73rd Terrace
- 23300 W 71st St
- 7102 Hedge Lane Terrace
- 23533 W 74th Terrace
- 7317 Silverheel St
- 7313 Silverheel St
- 22709 W 73rd St
- 22707 W 73rd St
- 22713 W 73rd St
- 7325 Silverheel St
- 22705 W 73rd St
- 7311 Silverheel St
- 22715 W 73rd St
- 22615 W 73rd St
- 7329 Silverheel St
- 22717 W 73rd St
- 22613 W 73rd St
- 7331 Silverheel St
- 22611 W 73rd St
- 22721 W 73rd St
- 22607 W 73rd St
- 7312 Mccoy St
- 22723 W 73rd St
- 7314 Mccoy St