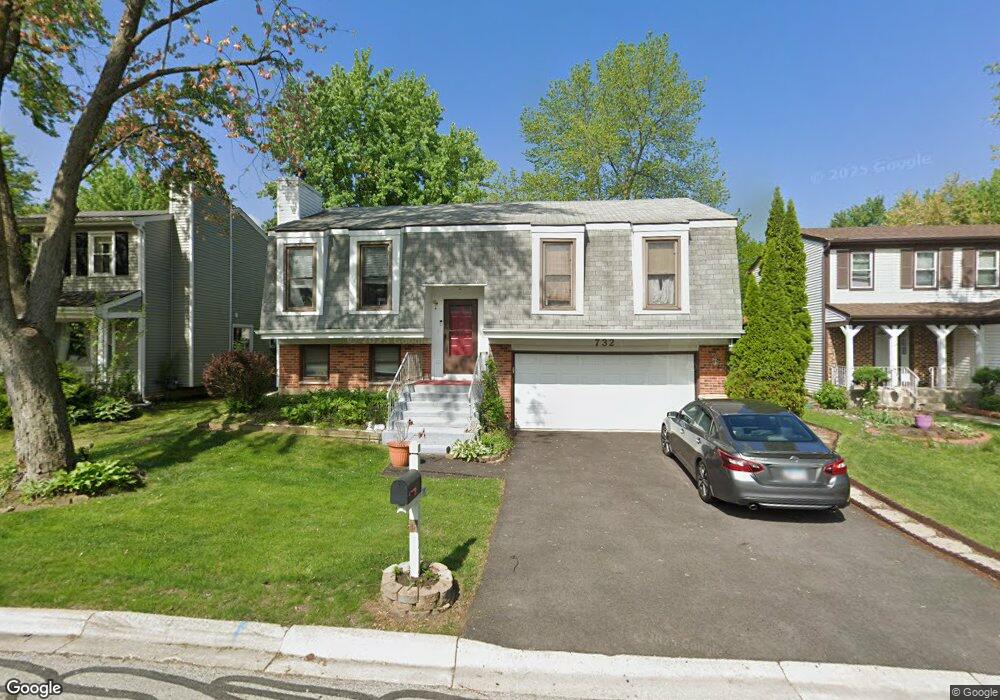
732 Cimarron Dr Carol Stream, IL 60188
Estimated Value: $349,000 - $396,000
3
Beds
2
Baths
2,102
Sq Ft
$174/Sq Ft
Est. Value
About This Home
This home is located at 732 Cimarron Dr, Carol Stream, IL 60188 and is currently estimated at $366,519, approximately $174 per square foot. 732 Cimarron Dr is a home located in DuPage County with nearby schools including Evergreen Elementary School, Benjamin Middle School, and West Chicago Community High School.
Ownership History
Date
Name
Owned For
Owner Type
Purchase Details
Closed on
Apr 17, 2003
Sold by
Kolakowski John E and Kolakowski Catherine
Bought by
Johnson Marion A
Current Estimated Value
Home Financials for this Owner
Home Financials are based on the most recent Mortgage that was taken out on this home.
Original Mortgage
$156,000
Outstanding Balance
$56,506
Interest Rate
3.62%
Mortgage Type
Purchase Money Mortgage
Estimated Equity
$310,013
Purchase Details
Closed on
May 27, 1999
Sold by
Patel Nimesh and Patel Nanda
Bought by
Kolakowski John and Kolakowski Catherine
Home Financials for this Owner
Home Financials are based on the most recent Mortgage that was taken out on this home.
Original Mortgage
$144,990
Interest Rate
7.06%
Mortgage Type
FHA
Create a Home Valuation Report for This Property
The Home Valuation Report is an in-depth analysis detailing your home's value as well as a comparison with similar homes in the area
Home Values in the Area
Average Home Value in this Area
Purchase History
| Date | Buyer | Sale Price | Title Company |
|---|---|---|---|
| Johnson Marion A | $195,000 | -- | |
| Kolakowski John | $146,000 | Heritage Title Company |
Source: Public Records
Mortgage History
| Date | Status | Borrower | Loan Amount |
|---|---|---|---|
| Open | Johnson Marion A | $156,000 | |
| Previous Owner | Kolakowski John | $144,990 |
Source: Public Records
Tax History
| Year | Tax Paid | Tax Assessment Tax Assessment Total Assessment is a certain percentage of the fair market value that is determined by local assessors to be the total taxable value of land and additions on the property. | Land | Improvement |
|---|---|---|---|---|
| 2024 | $7,373 | $101,722 | $34,212 | $67,510 |
| 2023 | $7,720 | $92,290 | $31,040 | $61,250 |
| 2022 | $7,367 | $85,770 | $28,850 | $56,920 |
| 2021 | $7,042 | $81,420 | $27,390 | $54,030 |
| 2020 | $6,860 | $78,980 | $26,570 | $52,410 |
| 2019 | $6,688 | $76,160 | $25,620 | $50,540 |
| 2018 | $6,218 | $71,800 | $24,160 | $47,640 |
| 2017 | $6,096 | $68,940 | $23,200 | $45,740 |
| 2016 | $5,970 | $65,850 | $22,160 | $43,690 |
| 2015 | $5,901 | $62,340 | $20,980 | $41,360 |
| 2014 | $5,667 | $58,840 | $20,450 | $38,390 |
| 2013 | $5,559 | $60,250 | $20,940 | $39,310 |
Source: Public Records
Map
Nearby Homes
- 848 Birchbark Trail
- 545 Alton Ct Unit 273
- 514 Alton Ct Unit 2
- 454 Esselen Ct Unit 2
- 734 Colorado Ct Unit 734
- 27W270 Jefferson St
- 1304 Yorkshire Ln
- 3N010 Woodview Dr
- 862 Omaha Ct
- 522 Apache Ln
- 552 Cochise Place
- 27W046 North Ave
- 1215 Robin Dr
- 992 Navajo St
- 813 Kansas St
- 403 Arrowhead Trail
- 1179 Edington Ct
- 1106 Pheasant Trail
- 426 Thunderbird Trail
- 1297 Woodlake Dr Unit 1
- 740 Cimarron Dr
- 724 Cimarron Dr
- 744 Cimarron Dr
- 735 Iroquois Trail
- 708 Cimarron Dr
- 739 Iroquois Trail
- 729 Iroquois Trail
- 745 Iroquois Trail
- 725 Iroquois Trail
- 750 Cimarron Dr
- 735 Cimarron Dr
- 731 Cimarron Dr
- 741 Cimarron Dr
- 749 Iroquois Trail
- 719 Iroquois Trail
- 725 Cimarron Dr
- 745 Cimarron Dr Unit 6
- 754 Cimarron Dr
- 721 Cimarron Dr
- 755 Iroquois Trail
Your Personal Tour Guide
Ask me questions while you tour the home.