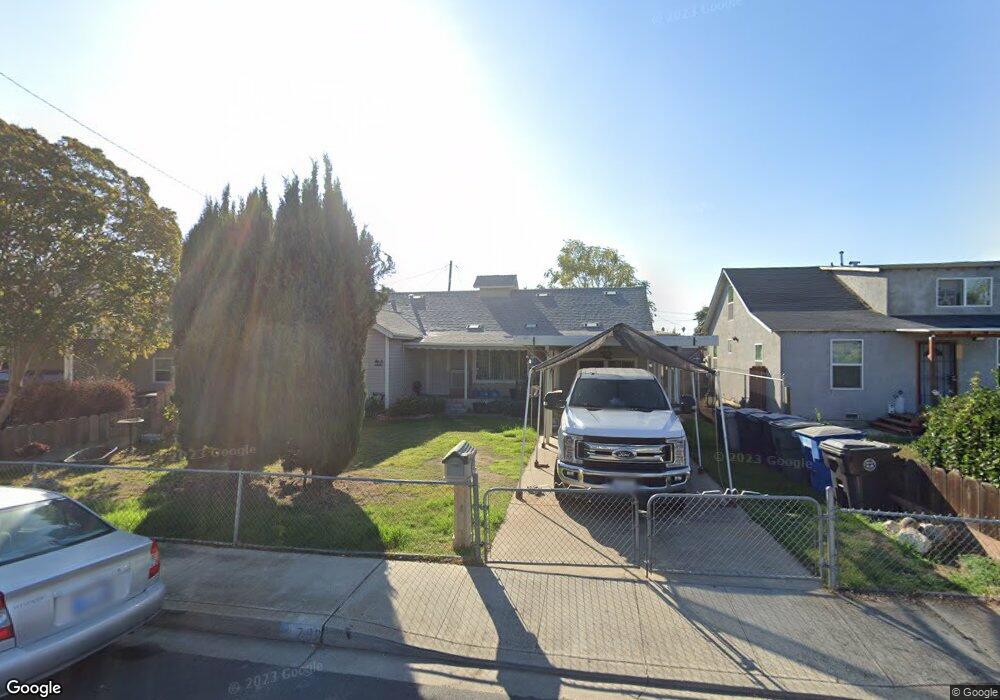
732 Nevada St Manteca, CA 95337
Downtown Manteca NeighborhoodEstimated Value: $381,000 - $504,000
4
Beds
1
Bath
1,664
Sq Ft
$269/Sq Ft
Est. Value
About This Home
This home is located at 732 Nevada St, Manteca, CA 95337 and is currently estimated at $448,014, approximately $269 per square foot. 732 Nevada St is a home located in San Joaquin County with nearby schools including Sequoia Elementary School, Manteca High School, and St. Anthony's Catholic School.
Ownership History
Date
Name
Owned For
Owner Type
Purchase Details
Closed on
Feb 15, 2001
Sold by
Bynum Frances C and Bynum Jack E
Bought by
Canady Donald R and Canady Laura M
Current Estimated Value
Home Financials for this Owner
Home Financials are based on the most recent Mortgage that was taken out on this home.
Original Mortgage
$121,800
Outstanding Balance
$43,370
Interest Rate
6.89%
Mortgage Type
FHA
Estimated Equity
$404,644
Create a Home Valuation Report for This Property
The Home Valuation Report is an in-depth analysis detailing your home's value as well as a comparison with similar homes in the area
Home Values in the Area
Average Home Value in this Area
Purchase History
| Date | Buyer | Sale Price | Title Company |
|---|---|---|---|
| Canady Donald R | $179,000 | Old Republic Title Company |
Source: Public Records
Mortgage History
| Date | Status | Borrower | Loan Amount |
|---|---|---|---|
| Open | Canady Donald R | $121,800 |
Source: Public Records
Tax History
| Year | Tax Paid | Tax Assessment Tax Assessment Total Assessment is a certain percentage of the fair market value that is determined by local assessors to be the total taxable value of land and additions on the property. | Land | Improvement |
|---|---|---|---|---|
| 2025 | $3,009 | $269,702 | $67,800 | $201,902 |
| 2024 | $2,926 | $264,415 | $66,471 | $197,944 |
| 2023 | $2,889 | $259,231 | $65,168 | $194,063 |
| 2022 | $2,847 | $254,149 | $63,891 | $190,258 |
| 2021 | $2,816 | $249,167 | $62,639 | $186,528 |
| 2020 | $2,702 | $246,613 | $61,997 | $184,616 |
| 2019 | $2,667 | $241,779 | $60,782 | $180,997 |
| 2018 | $2,632 | $237,040 | $59,591 | $177,449 |
| 2017 | $2,594 | $232,393 | $58,423 | $173,970 |
| 2016 | $2,531 | $227,836 | $57,277 | $170,559 |
| 2014 | $1,865 | $174,000 | $52,000 | $122,000 |
Source: Public Records
Map
Nearby Homes
- 811 Nevada St
- 119 Almond Ave
- 224 El Capitan Ave
- 207 Park Ave
- 1015 Tenaya Ct
- 1037 Tenaya Ct
- 360 Park Ave
- 241 Martha St
- 985 Camphor St
- 1023 Camphor St
- 316 Poplar Ave
- 322 Poplar Ave
- 290 Victory Ave
- 445 N Walnut Ave
- 502 Chablis Way
- 414 Cherry Ln Unit G
- 462 Chablis Way
- 1142 Mammoth Dr
- 426 Cherry Ln Unit H
- 123 Wawona St
Your Personal Tour Guide
Ask me questions while you tour the home.