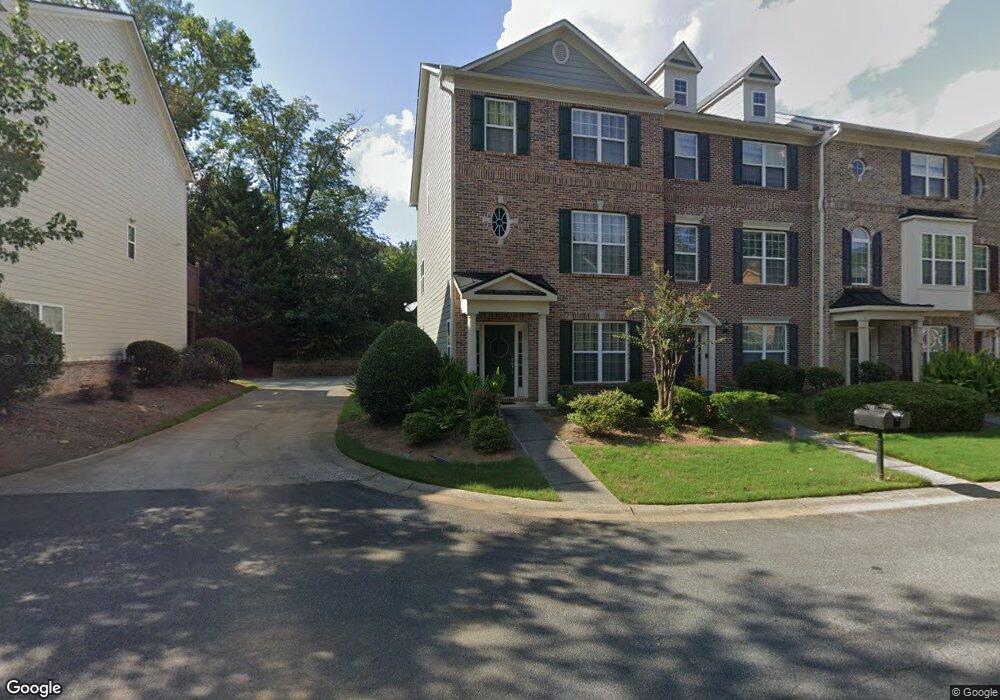
732 Pecan Knoll Dr Unit 8 Marietta, GA 30008
Estimated Value: $323,089 - $372,000
3
Beds
4
Baths
1,896
Sq Ft
$184/Sq Ft
Est. Value
About This Home
This home is located at 732 Pecan Knoll Dr Unit 8, Marietta, GA 30008 and is currently estimated at $348,522, approximately $183 per square foot. 732 Pecan Knoll Dr Unit 8 is a home located in Cobb County with nearby schools including Fair Oaks Elementary School, Osborne High School, and The Stonehaven School.
Ownership History
Date
Name
Owned For
Owner Type
Purchase Details
Closed on
Oct 18, 2010
Sold by
Hsbc Bk Usa
Bought by
Howell April
Current Estimated Value
Home Financials for this Owner
Home Financials are based on the most recent Mortgage that was taken out on this home.
Original Mortgage
$141,226
Outstanding Balance
$93,066
Interest Rate
4.4%
Mortgage Type
FHA
Estimated Equity
$255,456
Purchase Details
Closed on
Aug 3, 2010
Sold by
Swearingten John J
Bought by
Hsbc Bk Usa
Purchase Details
Closed on
Dec 16, 2005
Sold by
Venture Homes
Bought by
Swearingen John J and Ivy Robert
Home Financials for this Owner
Home Financials are based on the most recent Mortgage that was taken out on this home.
Original Mortgage
$224,500
Interest Rate
6.5%
Mortgage Type
New Conventional
Create a Home Valuation Report for This Property
The Home Valuation Report is an in-depth analysis detailing your home's value as well as a comparison with similar homes in the area
Home Values in the Area
Average Home Value in this Area
Purchase History
| Date | Buyer | Sale Price | Title Company |
|---|---|---|---|
| Howell April | $144,900 | -- | |
| Hsbc Bk Usa | $131,400 | -- | |
| Swearingen John J | $224,500 | -- |
Source: Public Records
Mortgage History
| Date | Status | Borrower | Loan Amount |
|---|---|---|---|
| Open | Howell April | $141,226 | |
| Previous Owner | Swearingen John J | $224,500 |
Source: Public Records
Tax History Compared to Growth
Tax History
| Year | Tax Paid | Tax Assessment Tax Assessment Total Assessment is a certain percentage of the fair market value that is determined by local assessors to be the total taxable value of land and additions on the property. | Land | Improvement |
|---|---|---|---|---|
| 2025 | $3,185 | $133,084 | $32,000 | $101,084 |
| 2024 | $3,188 | $133,084 | $32,000 | $101,084 |
| 2023 | $2,645 | $133,084 | $32,000 | $101,084 |
| 2022 | $2,650 | $107,416 | $32,000 | $75,416 |
| 2021 | $2,280 | $90,520 | $18,000 | $72,520 |
| 2020 | $2,280 | $90,520 | $18,000 | $72,520 |
| 2019 | $2,000 | $77,732 | $18,000 | $59,732 |
| 2018 | $1,798 | $68,460 | $16,000 | $52,460 |
| 2017 | $1,561 | $63,220 | $10,000 | $53,220 |
| 2016 | $1,223 | $51,428 | $10,000 | $41,428 |
| 2015 | $1,255 | $51,428 | $10,000 | $41,428 |
| 2014 | $1,069 | $44,812 | $0 | $0 |
Source: Public Records
Map
Nearby Homes
- 626 Pecan Knoll Dr Unit 13
- 607 Pecan Knoll Dr Unit 14
- 88 Garrison Rd SE
- 584 Bright St
- 533 Coral St
- 300 Senna St
- 313 Senna St
- 233 Scottsdale Dr
- 355 Niles Ct Unit 2
- 301 Niles Ct Unit 5
- 557 Henry Dr
- 99 Griggs St SW
- 209 Clay Dr SE Unit H3-5
- 243 Brownstone Cir Unit 25
- 188 Summit Ave SE
- 220 Clay Dr SE Unit 11
- 184 Summit Ave SE
- 1048 Brownstone Dr Unit 3
- 408 Silverbell Way
- 1252 Grampian Pass Unit 9
- 730 Pecan Knoll Dr Unit 8
- 728 Pecan Knoll Dr Unit 8
- 736 Pecan Knoll Dr Unit 7
- 726 Pecan Knoll Dr Unit 9
- 726 Pecan Knoll Dr Unit 8
- 726 Pecan Knoll Dr Unit 726
- 738 Pecan Knoll Dr Unit 7
- 1721 Pecan Knoll Dr
- 740 Pecan Knoll Dr Unit 7
- 733 Pecan Knoll Dr Unit 4
- 733 Pecan Knoll Dr
- 731 Pecan Knoll Dr Unit 4
- 742 Pecan Knoll Dr Unit 7
- 742 Pecan Knoll Dr
- 729 Pecan Knoll Dr Unit 4
- 727 Pecan Knoll Dr Unit 20
- 727 Pecan Knoll Dr Unit 4
- 708 Pecan Knoll Dr Unit 9
- 706 Pecan Knoll Dr Unit 9
- 725 Pecan Knoll Dr