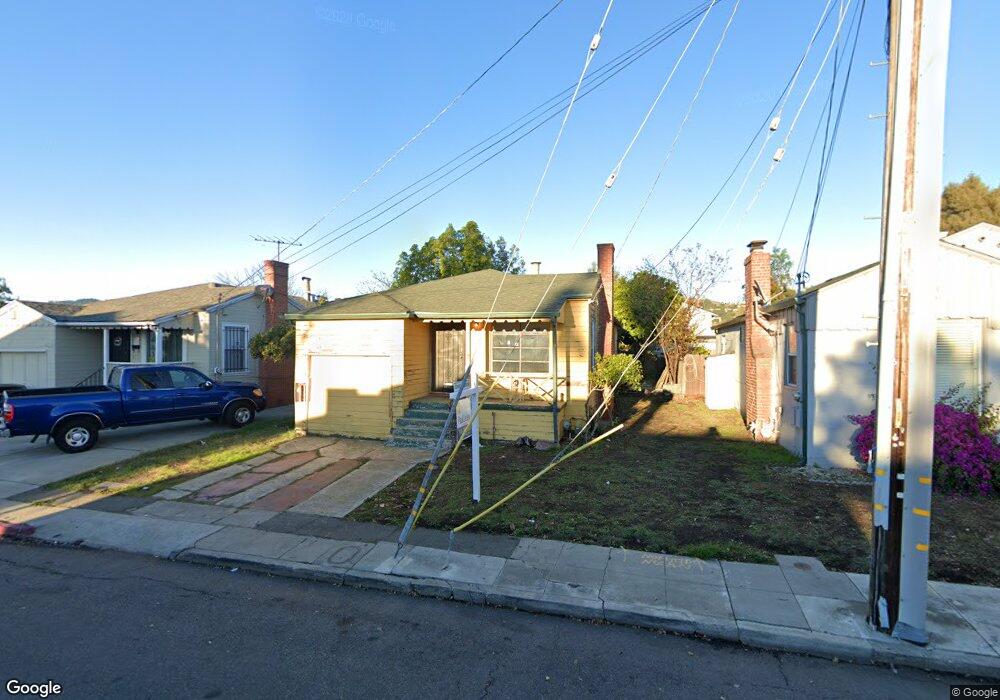
7320 Arthur St Oakland, CA 94605
Arroyo Viejo NeighborhoodEstimated Value: $503,000 - $596,000
2
Beds
1
Bath
1,010
Sq Ft
$529/Sq Ft
Est. Value
About This Home
This home is located at 7320 Arthur St, Oakland, CA 94605 and is currently estimated at $534,047, approximately $528 per square foot. 7320 Arthur St is a home located in Alameda County with nearby schools including Markham Elementary School, Frick United Academy of Language, and Coliseum College Prep Academy.
Ownership History
Date
Name
Owned For
Owner Type
Purchase Details
Closed on
Jul 7, 2022
Sold by
Nirmalani Abiaka
Bought by
Nirmalani Abiaka Living Trust
Current Estimated Value
Purchase Details
Closed on
Mar 13, 2018
Sold by
Camarena Melvin A and Camarena Mitra Delaram
Bought by
Abiaka Nirmalani
Home Financials for this Owner
Home Financials are based on the most recent Mortgage that was taken out on this home.
Original Mortgage
$425,000
Interest Rate
4.22%
Mortgage Type
New Conventional
Purchase Details
Closed on
Oct 21, 2017
Sold by
Camarena Melvin A
Bought by
Camarena Melvin A and Camarena Mitra Delaram
Purchase Details
Closed on
Sep 25, 2017
Sold by
Camarena Mitra Delaram
Bought by
Camarena Melvin A
Purchase Details
Closed on
Sep 18, 2017
Sold by
Anderson Louvell A and Estate Of Odessa H Anderson
Bought by
Camarena Melvin A
Purchase Details
Closed on
Jul 14, 2017
Sold by
Department Of Veterans Affairs Of The St
Bought by
Anderson M W and Anderson Odessa
Create a Home Valuation Report for This Property
The Home Valuation Report is an in-depth analysis detailing your home's value as well as a comparison with similar homes in the area
Home Values in the Area
Average Home Value in this Area
Purchase History
| Date | Buyer | Sale Price | Title Company |
|---|---|---|---|
| Nirmalani Abiaka Living Trust | -- | None Listed On Document | |
| Abiaka Nirmalani | $475,000 | Old Republic Title Company | |
| Camarena Melvin A | -- | None Available | |
| Camarena Melvin A | -- | Fidelity National Title Co | |
| Camarena Melvin A | $289,000 | Fidelity National Title Co | |
| Anderson M W | -- | Fidelity National Title |
Source: Public Records
Mortgage History
| Date | Status | Borrower | Loan Amount |
|---|---|---|---|
| Previous Owner | Abiaka Nirmalani | $425,000 |
Source: Public Records
Tax History Compared to Growth
Tax History
| Year | Tax Paid | Tax Assessment Tax Assessment Total Assessment is a certain percentage of the fair market value that is determined by local assessors to be the total taxable value of land and additions on the property. | Land | Improvement |
|---|---|---|---|---|
| 2025 | $8,526 | $540,458 | $162,137 | $378,321 |
| 2024 | $8,526 | $529,861 | $158,958 | $370,903 |
| 2023 | $8,926 | $519,473 | $155,842 | $363,631 |
| 2022 | $8,681 | $509,290 | $152,787 | $356,503 |
| 2021 | $8,277 | $499,305 | $149,791 | $349,514 |
| 2020 | $8,187 | $494,190 | $148,257 | $345,933 |
| 2019 | $7,865 | $484,500 | $145,350 | $339,150 |
| 2018 | $5,161 | $289,000 | $95,000 | $194,000 |
| 2017 | $12,834 | $42,673 | $17,745 | $24,928 |
| 2016 | $16,663 | $41,836 | $17,397 | $24,439 |
| 2015 | $1,533 | $41,208 | $17,136 | $24,072 |
| 2014 | $1,426 | $40,401 | $16,800 | $23,601 |
Source: Public Records
Map
Nearby Homes
- 7326 Arthur St
- 7314 Arthur St
- 7332 Arthur St
- 7321 Deerwood Ave
- 7315 Deerwood Ave
- 7327 Deerwood Ave
- 7400 Arthur St
- 7317 Arthur St
- 2130 73rd Ave
- 7325 Arthur St
- 7333 Deerwood Ave
- 7408 Arthur St
- 7339 Arthur St
- 7401 Arthur St
- 7401 Deerwood Ave
- 7412 Arthur St
- 2122 73rd Ave
- 7407 Arthur St
- 7407 Deerwood Ave
- 7320 Deerwood Ave