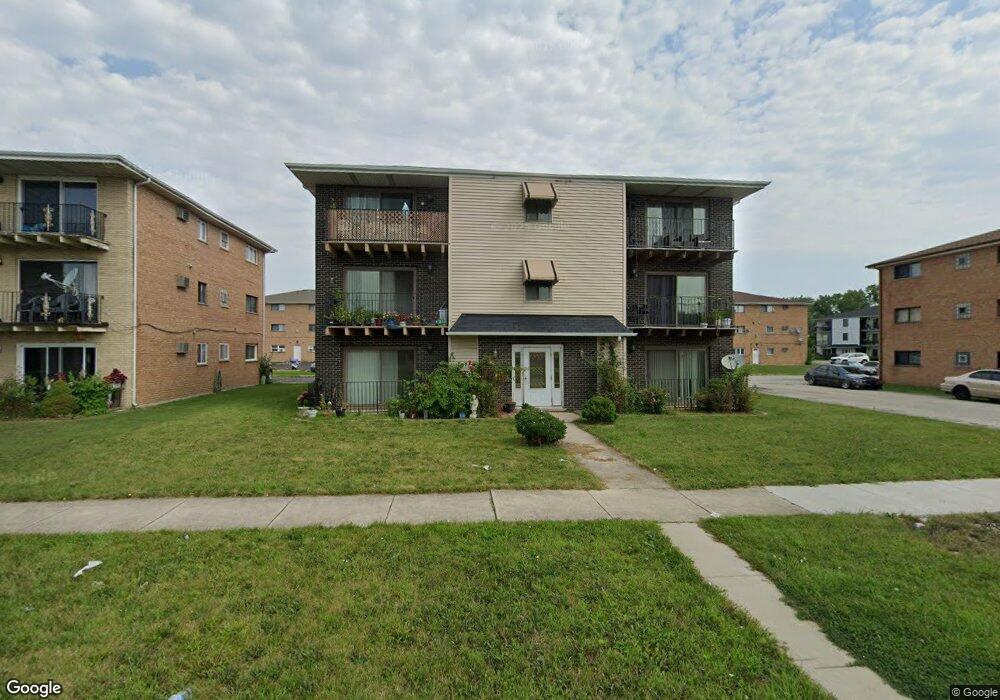
7320 W 86th St Unit 1W Bridgeview, IL 60455
Estimated Value: $159,814 - $203,000
2
Beds
1
Bath
850
Sq Ft
$203/Sq Ft
Est. Value
About This Home
This home is located at 7320 W 86th St Unit 1W, Bridgeview, IL 60455 and is currently estimated at $172,454, approximately $202 per square foot. 7320 W 86th St Unit 1W is a home located in Cook County with nearby schools including Bridgeview Elementary School, Argo Community High School, and Aqsa School.
Ownership History
Date
Name
Owned For
Owner Type
Purchase Details
Closed on
Jul 4, 2020
Sold by
Othman Adnan T
Bought by
Othman Hani A
Current Estimated Value
Purchase Details
Closed on
Mar 14, 2011
Sold by
U S Bank National Association
Bought by
Othman Adnan
Home Financials for this Owner
Home Financials are based on the most recent Mortgage that was taken out on this home.
Original Mortgage
$44,000
Interest Rate
4.52%
Mortgage Type
New Conventional
Purchase Details
Closed on
Jul 27, 2010
Sold by
Virgen
Bought by
Us Bank National Association
Purchase Details
Closed on
Jun 24, 2002
Sold by
George Annie S and Trust #1
Bought by
Virgen Gustavo and Vazquez Francisca
Home Financials for this Owner
Home Financials are based on the most recent Mortgage that was taken out on this home.
Original Mortgage
$83,600
Interest Rate
6.93%
Create a Home Valuation Report for This Property
The Home Valuation Report is an in-depth analysis detailing your home's value as well as a comparison with similar homes in the area
Home Values in the Area
Average Home Value in this Area
Purchase History
| Date | Buyer | Sale Price | Title Company |
|---|---|---|---|
| Othman Hani A | -- | None Available | |
| Othman Adnan | $55,000 | Git | |
| Us Bank National Association | -- | None Available | |
| Virgen Gustavo | $86,000 | Ticor Title Insurance Co |
Source: Public Records
Mortgage History
| Date | Status | Borrower | Loan Amount |
|---|---|---|---|
| Previous Owner | Othman Adnan | $44,000 | |
| Previous Owner | Virgen Gustavo | $83,600 |
Source: Public Records
Tax History Compared to Growth
Tax History
| Year | Tax Paid | Tax Assessment Tax Assessment Total Assessment is a certain percentage of the fair market value that is determined by local assessors to be the total taxable value of land and additions on the property. | Land | Improvement |
|---|---|---|---|---|
| 2024 | $2,897 | $11,712 | $853 | $10,859 |
| 2023 | $2,002 | $11,712 | $853 | $10,859 |
| 2022 | $2,002 | $8,429 | $2,037 | $6,392 |
| 2021 | $1,966 | $8,428 | $2,037 | $6,391 |
| 2020 | $1,988 | $8,428 | $2,037 | $6,391 |
| 2019 | $1,796 | $7,787 | $1,847 | $5,940 |
| 2018 | $1,714 | $7,787 | $1,847 | $5,940 |
| 2017 | $1,703 | $7,787 | $1,847 | $5,940 |
| 2016 | $1,864 | $7,048 | $1,610 | $5,438 |
| 2015 | $1,716 | $7,048 | $1,610 | $5,438 |
| 2014 | $1,679 | $7,048 | $1,610 | $5,438 |
| 2013 | $2,089 | $8,757 | $1,610 | $7,147 |
Source: Public Records
Map
Nearby Homes
- 7306 W 86th St Unit 3B
- 7336 W 86th St Unit 2B
- 7345 W 85th Place Unit 3A
- 8800 S Harlem Ave Unit 19
- 8800 S Harlem Ave Unit 2311
- 8800 S Harlem Ave Unit 2111
- 8800 S Harlem Ave
- 8232 S Ferdinand Ave
- 7110 W 82nd Place
- 8332 S 77th Ct
- 8400 New England Ave
- 8738 Newland Ave
- 8101 S Oketo Ave
- 8602 Oak Park Ave
- 8912 Windsor Ln
- 7806 W 83rd St
- 8356 Oak Park Ave
- 8332 S 78th Ct
- 7722 W 81st Place
- 9003 Milford Ct
- 7320 W 86th St Unit 1B
- 7320 W 86th St Unit 3B
- 7320 W 86th St Unit 2B
- 7320 W 86th St Unit 3A
- 7320 W 86th St Unit 1A
- 7320 W 86th St Unit 2A
- 7328 W 86th St Unit 3B
- 7328 W 86th St Unit 1B
- 7328 W 86th St Unit 2B
- 7328 W 86th St Unit 2A
- 7328 W 86th St Unit 1A
- 7328 W 86th St Unit 2E
- 7328 W 86th St Unit 1E
- 7312 W 86th St Unit 2A
- 7312 W 86th St Unit 1B
- 7312 W 86th St Unit 2B
- 7312 W 86th St Unit 1A
- 7312 W 86th St Unit 3A
- 7312 W 86th St Unit 3B
- 7321 W 85th Place Unit 3B