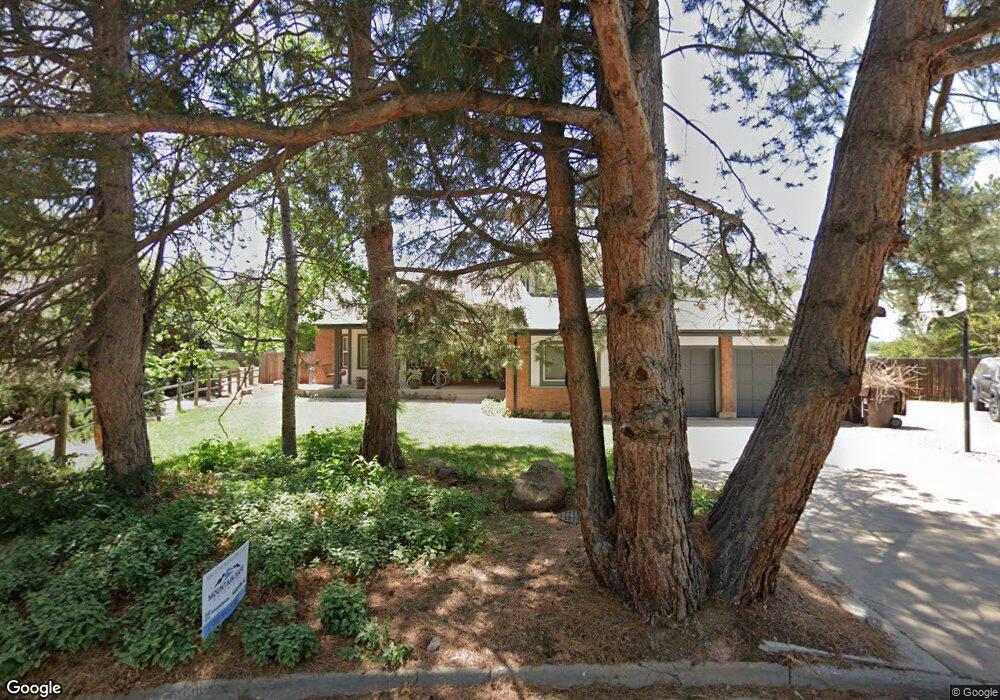
7321 Dry Creek Rd Niwot, CO 80503
Niwot NeighborhoodEstimated Value: $1,086,000 - $1,464,000
4
Beds
2
Baths
2,664
Sq Ft
$462/Sq Ft
Est. Value
About This Home
This home is located at 7321 Dry Creek Rd, Niwot, CO 80503 and is currently estimated at $1,230,382, approximately $461 per square foot. 7321 Dry Creek Rd is a home located in Boulder County with nearby schools including Niwot Elementary School, Sunset Middle School, and Niwot High School.
Ownership History
Date
Name
Owned For
Owner Type
Purchase Details
Closed on
Sep 20, 1995
Sold by
Warren Susan L
Bought by
Warren Bruce W
Current Estimated Value
Home Financials for this Owner
Home Financials are based on the most recent Mortgage that was taken out on this home.
Original Mortgage
$192,000
Interest Rate
7.88%
Purchase Details
Closed on
Jun 28, 1985
Bought by
Warren Susan L and Warren Bruce W
Purchase Details
Closed on
Nov 13, 1984
Bought by
Warren Susan L and Warren Bruce W
Purchase Details
Closed on
Feb 16, 1982
Bought by
Warren Susan L and Warren Bruce W
Create a Home Valuation Report for This Property
The Home Valuation Report is an in-depth analysis detailing your home's value as well as a comparison with similar homes in the area
Home Values in the Area
Average Home Value in this Area
Purchase History
| Date | Buyer | Sale Price | Title Company |
|---|---|---|---|
| Warren Bruce W | -- | Commonwealth Land Title | |
| Warren Susan L | -- | -- | |
| Warren Susan L | $133,000 | -- | |
| Warren Susan L | $137,000 | -- |
Source: Public Records
Mortgage History
| Date | Status | Borrower | Loan Amount |
|---|---|---|---|
| Closed | Warren Bruce W | $192,000 |
Source: Public Records
Tax History Compared to Growth
Tax History
| Year | Tax Paid | Tax Assessment Tax Assessment Total Assessment is a certain percentage of the fair market value that is determined by local assessors to be the total taxable value of land and additions on the property. | Land | Improvement |
|---|---|---|---|---|
| 2025 | $5,688 | $62,894 | $27,419 | $35,475 |
| 2024 | $5,688 | $62,894 | $27,419 | $35,475 |
| 2023 | $5,613 | $64,119 | $25,393 | $42,411 |
| 2022 | $3,851 | $44,459 | $22,886 | $21,573 |
| 2021 | $3,902 | $45,739 | $23,545 | $22,194 |
| 2020 | $3,743 | $44,266 | $20,592 | $23,674 |
| 2019 | $3,684 | $44,266 | $20,592 | $23,674 |
| 2018 | $3,275 | $40,370 | $16,992 | $23,378 |
| 2017 | $3,082 | $44,632 | $18,786 | $25,846 |
| 2016 | $2,804 | $37,484 | $18,786 | $18,698 |
| 2015 | $2,671 | $32,095 | $7,323 | $24,772 |
| 2014 | $3,204 | $32,095 | $7,323 | $24,772 |
Source: Public Records
Map
Nearby Homes
- 7284 Dry Creek Rd
- 7369 Pebble Ct
- 8180 Dry Creek Cir
- 8076 Meadowdale Square
- 8060 Niwot Rd Unit 66E
- 8060 Niwot Rd Unit 34
- 7187 Longview Dr
- 8050 Niwot Rd Unit 1
- 8050 Niwot Rd Unit 28
- 8050 Niwot Rd Unit 40
- 8400 Sawtooth Ln
- 8896 Niwot Rd
- 8748 Skyland Dr
- 3625 Nimbus Rd
- 9258 Niwot Hills Dr
- 6771 Niwot Hills Dr
- 9260 Shooting Star Ct
- 9261 Blue Spruce Ln
- 6703 Asher Ct
- 4759 Summerlin Place
- 7329 Dry Creek Rd
- 7315 Dry Creek Rd
- 7337 Dry Creek Rd
- 7309 Dry Creek Rd
- 8141 Meadowdale Ct
- 7332 Dry Creek Rd
- 7345 Dry Creek Rd
- 8131 Meadowdale Ct
- 7344 Dry Creek Rd
- 8140 Meadowdale Ct
- 7297 Dry Creek Rd
- 7320 Dry Creek Rd
- 7357 Dry Creek Rd
- 7356 Dry Creek Rd
- 8121 Meadowdale Ct
- 7308 Dry Creek Rd
- 8130 Meadowdale Ct
- 7285 Dry Creek Rd
- 7368 Dry Creek Rd
- 7367 Dry Creek Rd