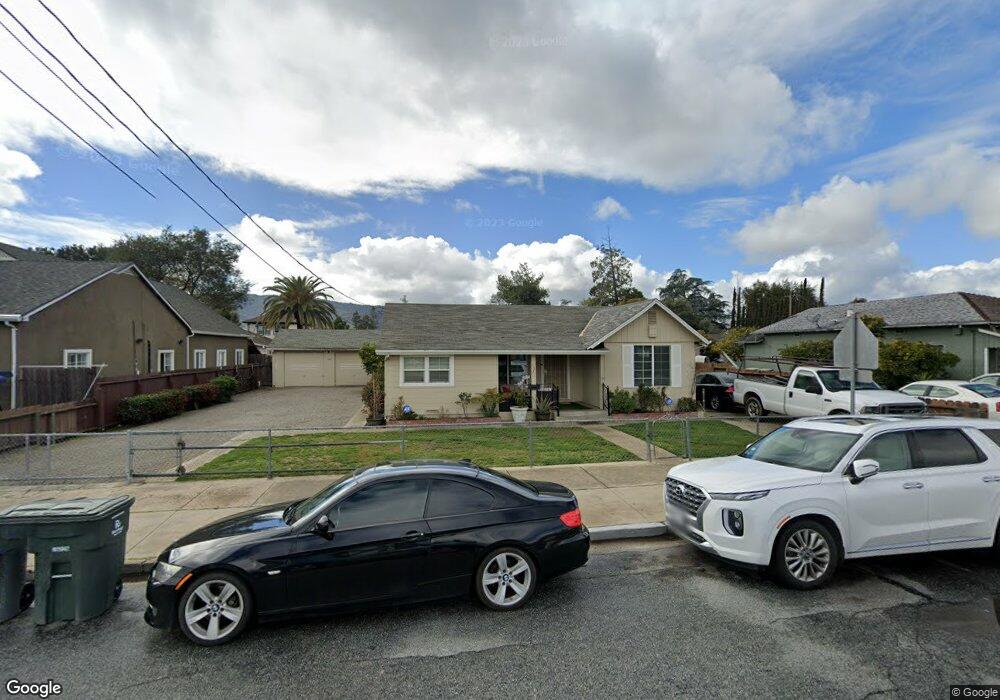
7321 Maple St Gilroy, CA 95020
Estimated Value: $553,000 - $915,000
2
Beds
1
Bath
1,335
Sq Ft
$560/Sq Ft
Est. Value
About This Home
This home is located at 7321 Maple St, Gilroy, CA 95020 and is currently estimated at $747,556, approximately $559 per square foot. 7321 Maple St is a home located in Santa Clara County with nearby schools including Eliot Elementary School, Brownell Middle School, and Solorsano Middle School.
Ownership History
Date
Name
Owned For
Owner Type
Purchase Details
Closed on
Jan 25, 2016
Sold by
Brown Barbara J and Settrini Alfred W
Bought by
Needham Derick and Needham Carmen
Current Estimated Value
Home Financials for this Owner
Home Financials are based on the most recent Mortgage that was taken out on this home.
Original Mortgage
$43,000
Outstanding Balance
$34,257
Interest Rate
3.93%
Mortgage Type
Credit Line Revolving
Estimated Equity
$713,299
Purchase Details
Closed on
Oct 28, 2008
Sold by
Settrini Alfred C and Settrini Mary Maxine
Bought by
Brown Barbara J and Settrini Alfred W
Purchase Details
Closed on
Oct 19, 1995
Sold by
Settrini Alfred C and Settrini Mary Maxine
Bought by
Settrini Alfred C and Settrini Mary Maxine
Create a Home Valuation Report for This Property
The Home Valuation Report is an in-depth analysis detailing your home's value as well as a comparison with similar homes in the area
Home Values in the Area
Average Home Value in this Area
Purchase History
| Date | Buyer | Sale Price | Title Company |
|---|---|---|---|
| Needham Derick | $430,000 | Stewart Title Of California | |
| Brown Barbara J | -- | None Available | |
| Settrini Alfred C | -- | None Available | |
| Settrini Alfred C | -- | -- |
Source: Public Records
Mortgage History
| Date | Status | Borrower | Loan Amount |
|---|---|---|---|
| Open | Needham Derick | $43,000 | |
| Open | Needham Derick | $344,000 |
Source: Public Records
Tax History
| Year | Tax Paid | Tax Assessment Tax Assessment Total Assessment is a certain percentage of the fair market value that is determined by local assessors to be the total taxable value of land and additions on the property. | Land | Improvement |
|---|---|---|---|---|
| 2025 | $6,244 | $509,027 | $355,136 | $153,891 |
| 2024 | $6,244 | $499,047 | $348,173 | $150,874 |
| 2023 | $6,208 | $489,263 | $341,347 | $147,916 |
| 2022 | $6,106 | $479,670 | $334,654 | $145,016 |
| 2021 | $6,078 | $470,266 | $328,093 | $142,173 |
| 2020 | $6,012 | $465,445 | $324,729 | $140,716 |
| 2019 | $5,956 | $456,319 | $318,362 | $137,957 |
| 2018 | $5,563 | $447,372 | $312,120 | $135,252 |
| 2017 | $5,680 | $438,600 | $306,000 | $132,600 |
| 2016 | $608 | $39,370 | $13,246 | $26,124 |
| 2015 | $577 | $38,780 | $13,048 | $25,732 |
| 2014 | $573 | $38,021 | $12,793 | $25,228 |
Source: Public Records
Map
Nearby Homes
- 262 E 6th St
- 332 Lewis St Unit 1/2
- 332 Lewis St
- 7621 Forest St
- 0 Monterey Rd
- 160 Sarafina Way
- 0 Pacheco Pass Hwy
- 7191 Eigleberry St
- 7051 Eigleberry St
- 194 4th St
- 7711 Monterey St
- 520 Polk Ct
- 7691 Church St Unit B
- 7630 Hanna St
- 45 Angra Way
- 7310 Carmel St
- 7681 Hanna St
- 8282 Murray Ave Unit 99
- 8282 Murray Ave Unit 65
- 500 W 10th St Unit 177
Your Personal Tour Guide
Ask me questions while you tour the home.