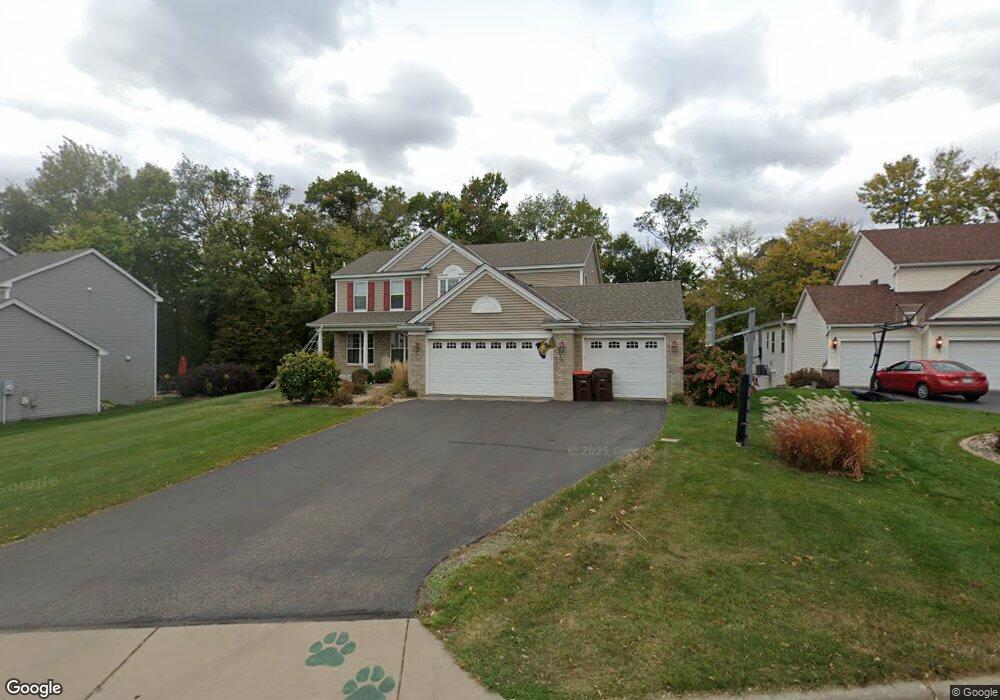
7322 Burr Oak Ave S Cottage Grove, MN 55016
Estimated Value: $525,135 - $585,000
4
Beds
3
Baths
2,500
Sq Ft
$218/Sq Ft
Est. Value
About This Home
This home is located at 7322 Burr Oak Ave S, Cottage Grove, MN 55016 and is currently estimated at $545,034, approximately $218 per square foot. 7322 Burr Oak Ave S is a home located in Washington County with nearby schools including Cottage Grove Elementary School, Oltman Middle School, and Park Senior High School.
Ownership History
Date
Name
Owned For
Owner Type
Purchase Details
Closed on
Apr 6, 2018
Sold by
Anderson Shawn and Anderson Megan
Bought by
Bauer Brandon Michael and Bauer Cara Ann
Current Estimated Value
Home Financials for this Owner
Home Financials are based on the most recent Mortgage that was taken out on this home.
Original Mortgage
$352,710
Outstanding Balance
$303,465
Interest Rate
4.46%
Mortgage Type
New Conventional
Estimated Equity
$241,569
Purchase Details
Closed on
Oct 30, 2015
Sold by
Wamhoff Chad F and Wamhoff Amy C
Bought by
Anderson Shawn and Anderson Megan
Home Financials for this Owner
Home Financials are based on the most recent Mortgage that was taken out on this home.
Original Mortgage
$327,750
Interest Rate
3.87%
Mortgage Type
New Conventional
Purchase Details
Closed on
Aug 18, 2005
Sold by
Pulte Homes Of Minnesota Corp
Bought by
Wamhoff Chad F and Wamhoff Amy C
Create a Home Valuation Report for This Property
The Home Valuation Report is an in-depth analysis detailing your home's value as well as a comparison with similar homes in the area
Home Values in the Area
Average Home Value in this Area
Purchase History
| Date | Buyer | Sale Price | Title Company |
|---|---|---|---|
| Bauer Brandon Michael | $391,900 | Watermark Title Agency | |
| Anderson Shawn | $345,000 | Home Title | |
| Wamhoff Chad F | $393,050 | -- |
Source: Public Records
Mortgage History
| Date | Status | Borrower | Loan Amount |
|---|---|---|---|
| Open | Bauer Brandon Michael | $352,710 | |
| Previous Owner | Anderson Shawn | $327,750 |
Source: Public Records
Tax History Compared to Growth
Tax History
| Year | Tax Paid | Tax Assessment Tax Assessment Total Assessment is a certain percentage of the fair market value that is determined by local assessors to be the total taxable value of land and additions on the property. | Land | Improvement |
|---|---|---|---|---|
| 2024 | $6,066 | $474,700 | $110,000 | $364,700 |
| 2023 | $6,066 | $522,100 | $150,000 | $372,100 |
| 2022 | $5,532 | $483,300 | $113,900 | $369,400 |
| 2021 | $5,552 | $401,400 | $94,600 | $306,800 |
| 2020 | $5,474 | $407,000 | $111,000 | $296,000 |
| 2019 | $5,246 | $389,900 | $87,000 | $302,900 |
| 2018 | $5,126 | $365,500 | $87,000 | $278,500 |
| 2017 | $4,848 | $351,600 | $90,000 | $261,600 |
| 2016 | $4,940 | $337,800 | $80,000 | $257,800 |
| 2015 | $4,544 | $336,900 | $86,000 | $250,900 |
| 2013 | -- | $292,900 | $61,300 | $231,600 |
Source: Public Records
Map
Nearby Homes
- 6933 Prairie Ct S
- 6961 E Point Douglas Rd S
- 6814 Meadow Grass Ln S
- 7320 Harkness Way S
- 1637 Pullman Ave
- 6745 Wildflower Dr S
- 8012 Scott Blvd
- 1601 14th Ave
- 7382 Timber Crest Dr S
- 6544 Wildflower Dr S
- 6811 Pine Crest Trail S
- 8196 Grange Blvd
- 6538 Genevieve Trail
- 7795 Hemingway Ave S Unit 7795
- 6291 Highland Hills Ln S
- 6295 Highland Hills Ln S
- 6636 Hinterland Trail S
- 6283 Highland Hills Ln S
- 6444 Genevieve Trail
- 1200 Holley Ave
- 7344 Burr Oak Ave S
- 7314 Burr Oak Ave S
- 7366 Burr Oak Ave S
- 7310 Burr Oak Ave S
- 7493 Granada Bay S
- 7311 Burr Oak Ave S
- 7388 Burr Oak Ave S
- 7355 Burr Oak Ave S
- 6754 Timber Ridge Trail S
- 7377 Burr Oak Ave S
- 7499 Granada Bay S
- 7485 Granada Bay S
- 6756 Timber Ridge Trail S
- 7391 Burr Oak Ave S
- 6768 Timber Ridge Trail S
- 7394 Burr Oak Ave S
- 7393 Burr Oak Ave S
- 7324 Meadow Grass Ave S
- 7312 Meadow Grass Ave S
- 6770 Timber Ridge Trail S