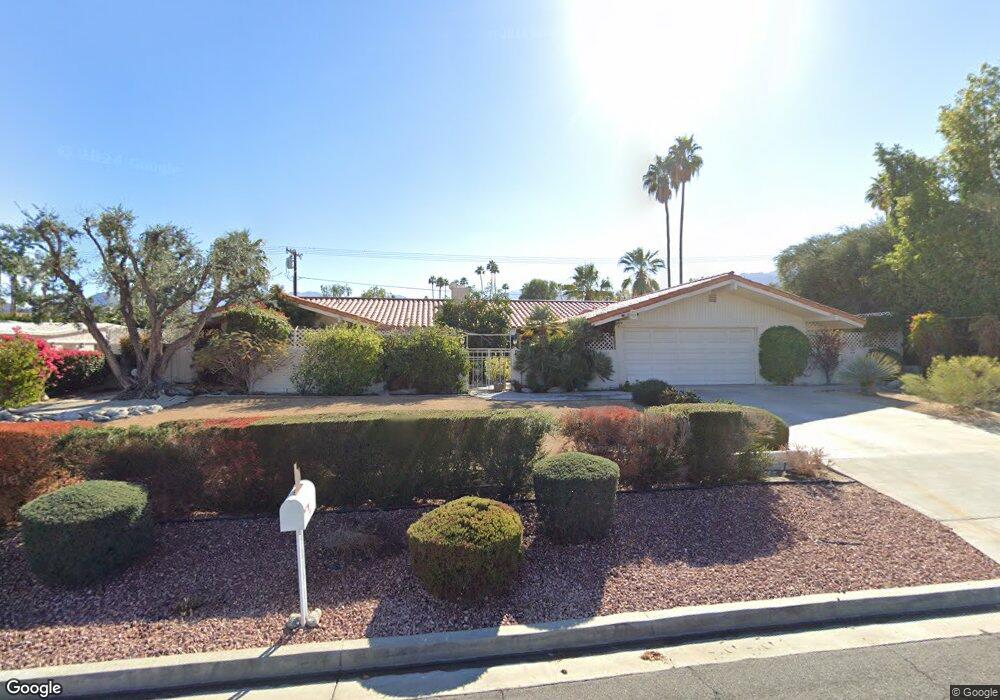
73225 Bursera Way Palm Desert, CA 92260
Estimated Value: $748,000 - $1,090,000
3
Beds
2
Baths
2,235
Sq Ft
$400/Sq Ft
Est. Value
About This Home
This home is located at 73225 Bursera Way, Palm Desert, CA 92260 and is currently estimated at $893,679, approximately $399 per square foot. 73225 Bursera Way is a home located in Riverside County with nearby schools including La Quinta Middle School, Palm Desert High School, and George Washington Charter School.
Ownership History
Date
Name
Owned For
Owner Type
Purchase Details
Closed on
Jan 26, 2004
Sold by
Cosbie Richard and Cosbie Laurel
Bought by
Cosbie Richard G and Cosbie Laurel Beth
Current Estimated Value
Purchase Details
Closed on
May 19, 1999
Sold by
Cosbie and Laurel
Bought by
Cosbie Richard G and Cosbie Laurel Beth
Purchase Details
Closed on
Jan 12, 1998
Sold by
Cox John R & Barbara B Trust and Cox
Bought by
Cosbie Richard and Cosbie Laurel
Home Financials for this Owner
Home Financials are based on the most recent Mortgage that was taken out on this home.
Original Mortgage
$200,000
Outstanding Balance
$34,435
Interest Rate
7.05%
Mortgage Type
Seller Take Back
Estimated Equity
$859,245
Purchase Details
Closed on
Feb 19, 1997
Sold by
Cox John R & Barbara B Trust and Cox R
Bought by
Cox John R
Create a Home Valuation Report for This Property
The Home Valuation Report is an in-depth analysis detailing your home's value as well as a comparison with similar homes in the area
Home Values in the Area
Average Home Value in this Area
Purchase History
| Date | Buyer | Sale Price | Title Company |
|---|---|---|---|
| Cosbie Richard G | -- | -- | |
| Cosbie Richard | -- | -- | |
| Cosbie Richard G | -- | -- | |
| Cosbie Richard | $250,000 | Old Republic Title Company | |
| Cox John R | -- | -- |
Source: Public Records
Mortgage History
| Date | Status | Borrower | Loan Amount |
|---|---|---|---|
| Open | Cosbie Richard | $200,000 |
Source: Public Records
Tax History Compared to Growth
Tax History
| Year | Tax Paid | Tax Assessment Tax Assessment Total Assessment is a certain percentage of the fair market value that is determined by local assessors to be the total taxable value of land and additions on the property. | Land | Improvement |
|---|---|---|---|---|
| 2025 | $5,494 | $407,135 | $63,847 | $343,288 |
| 2023 | $5,494 | $391,327 | $61,369 | $329,958 |
| 2022 | $5,165 | $383,655 | $60,166 | $323,489 |
| 2021 | $5,045 | $376,134 | $58,987 | $317,147 |
| 2020 | $4,957 | $372,279 | $58,383 | $313,896 |
| 2019 | $4,865 | $364,981 | $57,239 | $307,742 |
| 2018 | $4,776 | $357,825 | $56,118 | $301,707 |
| 2017 | $4,678 | $350,810 | $55,018 | $295,792 |
| 2016 | $4,579 | $343,933 | $53,940 | $289,993 |
| 2015 | $4,583 | $338,769 | $53,131 | $285,638 |
| 2014 | $4,379 | $332,136 | $52,092 | $280,044 |
Source: Public Records
Map
Nearby Homes
- 73197 Rod Laver Ln
- 73225 Rod Laver Ln
- 73242 Don Budge Ln
- 73067 Pancho Segura Ln
- 73162 Bill Tilden Ln
- 73286 Goldflower St
- 73005 Pancho Segura Ln
- 73308 Salt Cedar St
- 72964 Ken Rosewall Ln
- 73297 Grapevine St
- 72930 Willow St
- 72869 Don Larson Ln
- 72853 Don Larson Ln
- 72864 Roy Emerson Ln
- 72950 Amber St
- 72847 Don Larson Ln
- 72807 Don Larson Ln
- 73200 Calliandra St
- 72890 Amber St
- 72955 Deer Grass Dr
- 73241 Bursera Way
- 73185 Bursera Way
- 73147 Bursera Way
- 73245 Bursera Way
- 73169 Alice Marble Ln
- 73167 Alice Marble Ln
- 73184 Bursera Way
- 73199 Rod Laver Ln
- 73147 Alice Marble Ln
- 73189 Alice Marble Ln
- 73165 Alice Marble Ln
- 73149 Alice Marble Ln
- 73173 Alice Marble Ln
- 73163 Alice Marble Ln
- 73195 Rod Laver Ln
- 73209 Rod Laver Ln
- 73193 Rod Laver Ln
- 73207 Rod Laver Ln Unit 122
- 73249 Bursera Way Unit 21
- 73336 Bursera Way