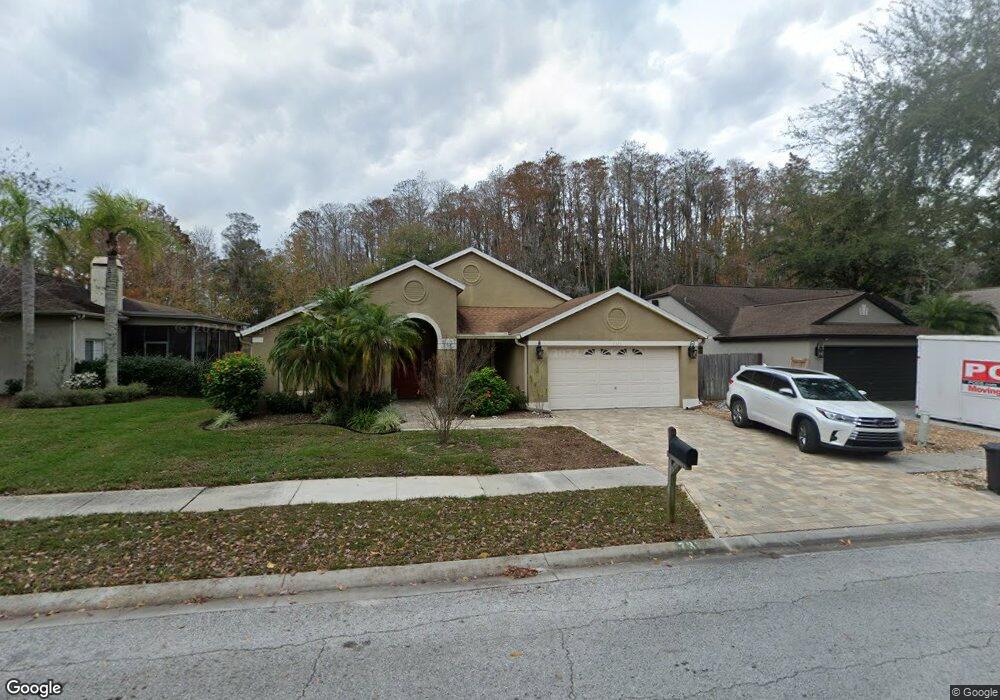
7323 Captiva Cir New Port Richey, FL 34655
Estimated Value: $405,020 - $464,000
--
Bed
2
Baths
1,909
Sq Ft
$233/Sq Ft
Est. Value
About This Home
This home is located at 7323 Captiva Cir, New Port Richey, FL 34655 and is currently estimated at $444,505, approximately $232 per square foot. 7323 Captiva Cir is a home located in Pasco County with nearby schools including Trinity Oaks Elementary School, Seven Springs Middle School, and James W. Mitchell High School.
Ownership History
Date
Name
Owned For
Owner Type
Purchase Details
Closed on
Sep 1, 2016
Sold by
Misemer Jake R and Misemer Nicole L
Bought by
Reams Wilford and Reams Melisa
Current Estimated Value
Home Financials for this Owner
Home Financials are based on the most recent Mortgage that was taken out on this home.
Original Mortgage
$171,200
Outstanding Balance
$136,598
Interest Rate
3.48%
Mortgage Type
New Conventional
Estimated Equity
$307,907
Purchase Details
Closed on
Aug 1, 2001
Sold by
Bartle John S and Bartle Moye Bartle
Bought by
Misemer Jake R and Misemer Nicole L
Home Financials for this Owner
Home Financials are based on the most recent Mortgage that was taken out on this home.
Original Mortgage
$100,000
Interest Rate
7.09%
Mortgage Type
New Conventional
Purchase Details
Closed on
Oct 18, 2000
Sold by
Hintenach John W and Hintenach Kimberly L
Bought by
Bartle John S
Create a Home Valuation Report for This Property
The Home Valuation Report is an in-depth analysis detailing your home's value as well as a comparison with similar homes in the area
Home Values in the Area
Average Home Value in this Area
Purchase History
| Date | Buyer | Sale Price | Title Company |
|---|---|---|---|
| Reams Wilford | $214,000 | None Available | |
| Misemer Jake R | $152,000 | -- | |
| Bartle John S | $138,000 | -- |
Source: Public Records
Mortgage History
| Date | Status | Borrower | Loan Amount |
|---|---|---|---|
| Open | Reams Wilford | $171,200 | |
| Previous Owner | Bartle John S | $103,000 | |
| Previous Owner | Bartle John S | $103,000 | |
| Previous Owner | Bartle John S | $50,000 | |
| Previous Owner | Bartle John S | $100,000 |
Source: Public Records
Tax History Compared to Growth
Tax History
| Year | Tax Paid | Tax Assessment Tax Assessment Total Assessment is a certain percentage of the fair market value that is determined by local assessors to be the total taxable value of land and additions on the property. | Land | Improvement |
|---|---|---|---|---|
| 2025 | $6,002 | $399,538 | $73,613 | $325,925 |
| 2024 | $6,002 | $399,410 | $73,613 | $325,797 |
| 2023 | $5,506 | $276,360 | $0 | $0 |
| 2022 | $4,455 | $302,022 | $53,528 | $248,494 |
| 2021 | $3,867 | $228,403 | $48,006 | $180,397 |
| 2020 | $3,694 | $219,407 | $48,006 | $171,401 |
| 2019 | $3,389 | $196,780 | $48,006 | $148,774 |
| 2018 | $3,285 | $189,968 | $48,006 | $141,962 |
| 2017 | $3,232 | $183,147 | $48,006 | $135,141 |
| 2016 | $1,817 | $138,332 | $0 | $0 |
| 2015 | $1,840 | $137,370 | $0 | $0 |
| 2014 | $1,788 | $140,169 | $37,801 | $102,368 |
Source: Public Records
Map
Nearby Homes
- 7227 Otter Creek Dr
- 7516 Cypress Walk Dr
- 7320 Hideaway Trail
- 2218 Egret Walk Ct
- 7451 Wimpole Dr
- 7501 Turtlebrook Ln
- 2616 Tottenham Dr
- 7230 Hummingbird Ln
- 7638 Cypress Walk Dr
- 2648 Tottenham Dr
- 2652 Tottenham Dr
- 2449 Moon Shadow Rd
- 2649 Tottenham Dr
- 7731 Cypress Walk Dr
- 2538 Evershot Dr
- 7119 Hummingbird Ln
- 7115 Hummingbird Ln
- 1904 Paw Place
- 2753 Oak Bend Ct
- 2806 Manning Dr
- 7329 Captiva Cir
- 7317 Captiva Cir
- 7309 Captiva Cir
- 7331 Captiva Cir
- 7341 Captiva Cir
- 7320 Captiva Cir
- 7316 Captiva Cir
- 7312 Captiva Cir
- 7336 Song Bird Dr
- 7304 Captiva Cir
- 7345 Captiva Cir
- 7249 Captiva Cir
- 7252 Captiva Cir
- 7344 Song Bird Dr
- 7351 Captiva Cir
- 7248 Captiva Cir
- 7239 Arboretum Way
- 7241 Captiva Cir
- 7244 Captiva Cir
- 7233 Arboretum Way