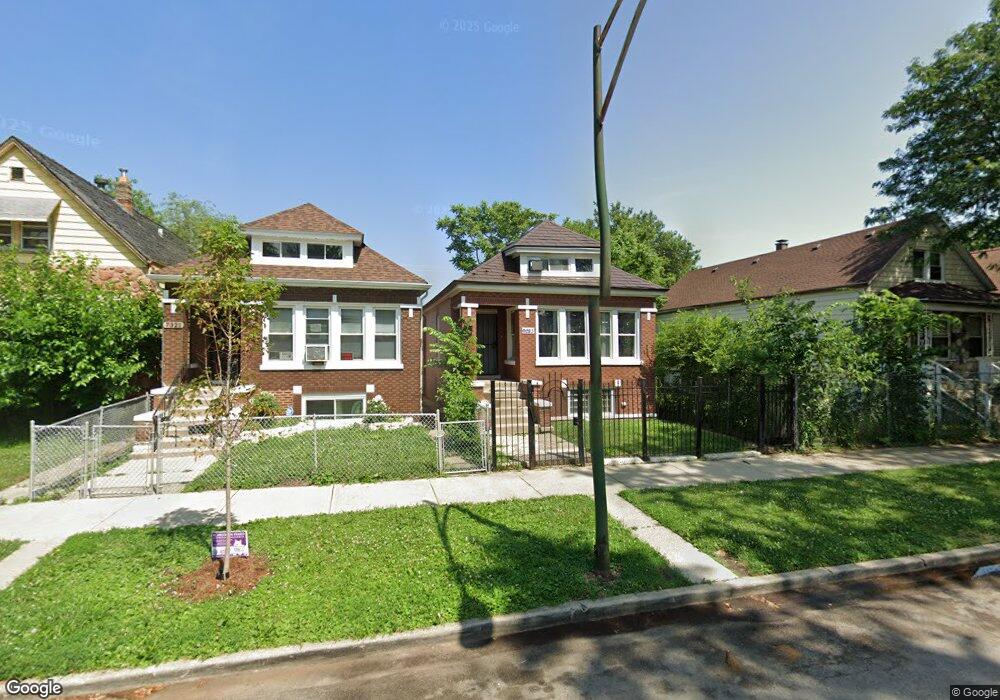
7323 S Marshfield Ave Chicago, IL 60636
Englewood NeighborhoodEstimated Value: $154,000 - $251,000
3
Beds
2
Baths
981
Sq Ft
$188/Sq Ft
Est. Value
About This Home
This home is located at 7323 S Marshfield Ave, Chicago, IL 60636 and is currently estimated at $184,472, approximately $188 per square foot. 7323 S Marshfield Ave is a home located in Cook County with nearby schools including Randolph Elementary School and The Montessori School of Englewood Charter School.
Ownership History
Date
Name
Owned For
Owner Type
Purchase Details
Closed on
Oct 12, 2018
Sold by
Dynasty Holdings Inc
Bought by
Dynasty Holdings 2 Llc
Current Estimated Value
Purchase Details
Closed on
Mar 28, 2018
Sold by
Greens400 Llc
Bought by
Dynasty Holdings Inc
Purchase Details
Closed on
Jan 29, 2018
Sold by
Abc Bank
Bought by
Greens400 Llc
Purchase Details
Closed on
Sep 7, 2016
Sold by
Pebbleford Holdings Llc
Bought by
Abc Bank and Austin Bank Of Chicago
Purchase Details
Closed on
May 18, 2011
Sold by
Deutsche Bank National Trust Company
Bought by
Stonecrest Investments Llc
Purchase Details
Closed on
Mar 30, 2010
Sold by
Stonecrest Income & Opportunity Fund 1 L
Bought by
Pebbleford Holdings Llc
Home Financials for this Owner
Home Financials are based on the most recent Mortgage that was taken out on this home.
Original Mortgage
$500,000
Interest Rate
3.25%
Mortgage Type
Credit Line Revolving
Purchase Details
Closed on
Jul 2, 2009
Sold by
Lobianco Richard J and Lobianco Richard
Bought by
Deutsche Bank National Trust Company
Purchase Details
Closed on
Nov 30, 2005
Sold by
Story Shirley J and Sanders Pamela A
Bought by
Lobianco Richard J
Home Financials for this Owner
Home Financials are based on the most recent Mortgage that was taken out on this home.
Original Mortgage
$114,000
Interest Rate
8.12%
Mortgage Type
Unknown
Purchase Details
Closed on
Oct 1, 2001
Sold by
Davis Robert L and Davis Barbara
Bought by
Stroy Shirley J and Sanders Pamela A
Home Financials for this Owner
Home Financials are based on the most recent Mortgage that was taken out on this home.
Original Mortgage
$70,975
Interest Rate
9.99%
Create a Home Valuation Report for This Property
The Home Valuation Report is an in-depth analysis detailing your home's value as well as a comparison with similar homes in the area
Home Values in the Area
Average Home Value in this Area
Purchase History
| Date | Buyer | Sale Price | Title Company |
|---|---|---|---|
| Dynasty Holdings 2 Llc | -- | None Available | |
| Dynasty Holdings Inc | -- | None Available | |
| Greens400 Llc | $12,500 | None Available | |
| Abc Bank | -- | None Available | |
| Stonecrest Investments Llc | $7,239 | None Available | |
| Pebbleford Holdings Llc | $500 | Success Title Services Inc | |
| Deutsche Bank National Trust Company | -- | None Available | |
| Lobianco Richard J | $120,000 | -- | |
| Stroy Shirley J | $83,500 | Professional National Title |
Source: Public Records
Mortgage History
| Date | Status | Borrower | Loan Amount |
|---|---|---|---|
| Previous Owner | Pebbleford Holdings Llc | $500,000 | |
| Previous Owner | Lobianco Richard J | $114,000 | |
| Previous Owner | Stroy Shirley J | $70,975 | |
| Closed | Stroy Shirley J | $8,350 |
Source: Public Records
Tax History
| Year | Tax Paid | Tax Assessment Tax Assessment Total Assessment is a certain percentage of the fair market value that is determined by local assessors to be the total taxable value of land and additions on the property. | Land | Improvement |
|---|---|---|---|---|
| 2025 | $2,321 | $6,801 | $938 | $5,863 |
| 2024 | $2,321 | $6,801 | $938 | $5,863 |
| 2023 | $2,262 | $11,000 | $2,031 | $8,969 |
| 2022 | $2,262 | $11,000 | $2,031 | $8,969 |
| 2021 | $2,212 | $10,999 | $2,031 | $8,968 |
| 2020 | $1,347 | $6,047 | $2,031 | $4,016 |
| 2019 | $1,350 | $6,719 | $2,031 | $4,688 |
| 2018 | $1,327 | $6,719 | $2,031 | $4,688 |
| 2017 | $1,385 | $6,434 | $1,875 | $4,559 |
| 2016 | $1,289 | $6,434 | $1,875 | $4,559 |
| 2015 | $1,179 | $6,434 | $1,875 | $4,559 |
| 2014 | $1,159 | $6,248 | $1,718 | $4,530 |
| 2013 | $1,136 | $6,248 | $1,718 | $4,530 |
Source: Public Records
Map
Nearby Homes
- 7253 S Marshfield Ave
- 7241 S Marshfield Ave
- 1514 W 73rd St
- 7225 S Paulina St
- 7244 S Paulina St
- 7238 S Paulina St
- 1509 W 72nd Place
- 1472 W 74th St
- 7228 S Hermitage Ave
- 1444 W 72nd Place
- 7330 S Wood St
- 7246 S Wood St
- 7149 S Wood St
- 7349 S Honore St
- 1413 W 73rd St
- 7332 S Honore St
- 1544 W 71st St
- 7154 S Honore St
- 1409 W 71st Place
- 1809 W 71st St
- 7321 S Marshfield Ave
- 7319 S Marshfield Ave
- 7329 S Marshfield Ave
- 7331 S Marshfield Ave
- 7315 S Marshfield Ave
- 7333 S Marshfield Ave
- 7313 S Marshfield Ave
- 7311 S Marshfield Ave
- 7337 S Marshfield Ave
- 7330 S Ashland Ave
- 7312 S Ashland Ave
- 7307 S Marshfield Ave
- 7341 S Marshfield Ave
- 7322 S Marshfield Ave
- 7324 S Marshfield Ave
- 7320 S Marshfield Ave
- 7328 S Marshfield Ave
- 7303 S Marshfield Ave
- 7343 S Marshfield Ave
- 7330 S Marshfield Ave
Your Personal Tour Guide
Ask me questions while you tour the home.