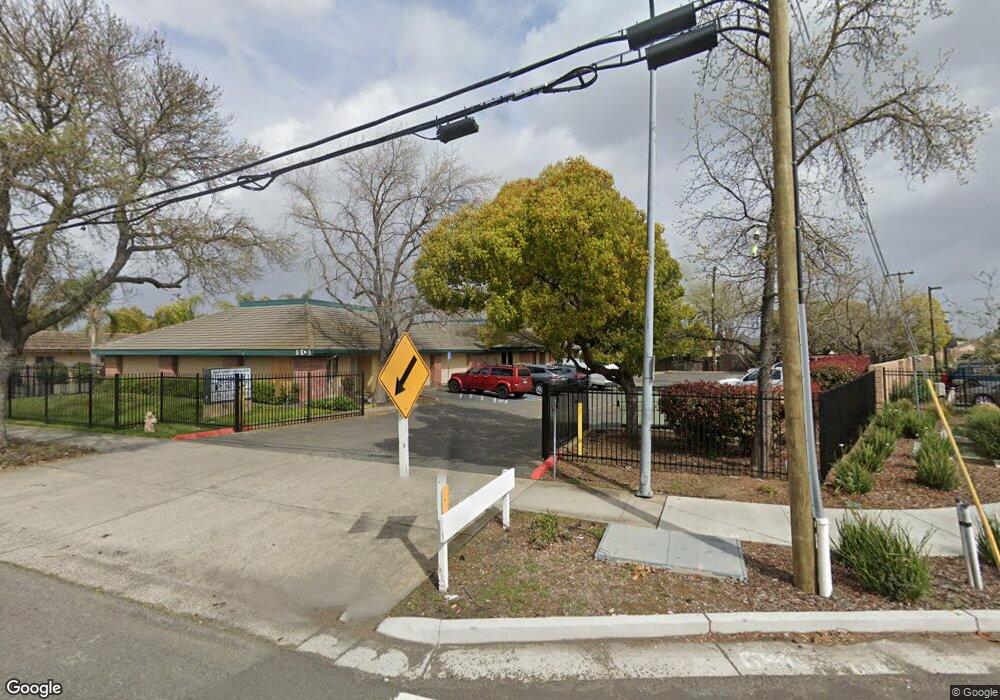
7323 Stockton Blvd Sacramento, CA 95823
Estimated Value: $726,234
--
Bed
--
Bath
5,296
Sq Ft
$137/Sq Ft
Est. Value
About This Home
This home is located at 7323 Stockton Blvd, Sacramento, CA 95823 and is currently estimated at $726,234, approximately $137 per square foot. 7323 Stockton Blvd is a home located in Sacramento County with nearby schools including David Reese Elementary School, James Rutter Middle School, and Florin High School.
Ownership History
Date
Name
Owned For
Owner Type
Purchase Details
Closed on
Sep 30, 2022
Sold by
Zoette Treaster Revocable Trust
Bought by
Tongan Community Christian Center Of Sacramen
Current Estimated Value
Home Financials for this Owner
Home Financials are based on the most recent Mortgage that was taken out on this home.
Original Mortgage
$507,500
Outstanding Balance
$460,879
Interest Rate
5.55%
Mortgage Type
New Conventional
Estimated Equity
$265,355
Purchase Details
Closed on
Sep 11, 2001
Sold by
Treaster Zoette
Bought by
Treaster Zoette and The Zoette Treaster Revocable
Purchase Details
Closed on
Apr 24, 1995
Sold by
Paoluccio Robert and Paoluccio Charlene F
Bought by
Treaster Zoette
Home Financials for this Owner
Home Financials are based on the most recent Mortgage that was taken out on this home.
Original Mortgage
$230,000
Interest Rate
8.44%
Mortgage Type
Seller Take Back
Create a Home Valuation Report for This Property
The Home Valuation Report is an in-depth analysis detailing your home's value as well as a comparison with similar homes in the area
Home Values in the Area
Average Home Value in this Area
Purchase History
| Date | Buyer | Sale Price | Title Company |
|---|---|---|---|
| Tongan Community Christian Center Of Sacramen | $699,000 | Stewart Title | |
| Treaster Zoette | -- | -- | |
| Treaster Zoette | $350,000 | Fidelity National Title |
Source: Public Records
Mortgage History
| Date | Status | Borrower | Loan Amount |
|---|---|---|---|
| Open | Tongan Community Christian Center Of Sacramen | $507,500 | |
| Previous Owner | Treaster Zoette | $230,000 |
Source: Public Records
Tax History Compared to Growth
Tax History
| Year | Tax Paid | Tax Assessment Tax Assessment Total Assessment is a certain percentage of the fair market value that is determined by local assessors to be the total taxable value of land and additions on the property. | Land | Improvement |
|---|---|---|---|---|
| 2025 | $8,182 | $727,239 | $259,059 | $468,180 |
| 2024 | $8,182 | $712,980 | $253,980 | $459,000 |
| 2023 | $7,981 | $699,000 | $249,000 | $450,000 |
| 2022 | $6,463 | $553,968 | $174,100 | $379,868 |
| 2021 | $6,393 | $543,107 | $170,687 | $372,420 |
| 2020 | $6,308 | $537,539 | $168,937 | $368,602 |
| 2019 | $6,196 | $527,000 | $165,625 | $361,375 |
| 2018 | $6,035 | $516,668 | $162,378 | $354,290 |
| 2017 | $5,937 | $506,539 | $159,195 | $347,344 |
| 2016 | $5,731 | $496,608 | $156,074 | $340,534 |
| 2015 | $5,631 | $489,149 | $153,730 | $335,419 |
| 2014 | $5,545 | $479,568 | $150,719 | $328,849 |
Source: Public Records
Map
Nearby Homes
- 7312 Del Prado Way
- 6400 66th Ave Unit 21
- 6944 Mirador Way
- 7548 Lindale Dr
- 6104 Center Mall Way
- 7120 Conrad Dr
- 6837 Southwood Way
- 6124 Pomegranate Ave
- 7020 Sunnyslope Dr
- 7413 Skander Way
- 6532 Harley Way
- 5906 Stacy Ave
- 6924 Peck Dr
- 7548 Huckleberry Ln
- 7451 Albezzia Ln
- 7327 Berna Way
- 7551 Red Bud Ln
- 7319 Berna Way
- 7320 Berna Way
- 7314 Berna Way
- 7318 Sahara Ct
- 7320 Sahara Ct
- 7316 Sahara Ct
- 7308 Lindale Dr
- 7322 Sahara Ct
- 7312 Lindale Dr
- 7304 Lindale Dr
- 7301 Stockton Blvd
- 7324 Sahara Ct
- 7326 Sahara Ct
- 7300 Lindale Dr
- 6600 Flamingo Way
- 7305 Lindale Dr
- 7304 Del Prado Way
- 7334 Lindale Dr
- 7323 Lindale Dr
- 7308 Del Prado Way
- 7301 Lindale Dr
- 7329 Lindale Dr
- 7272 Lindale Dr