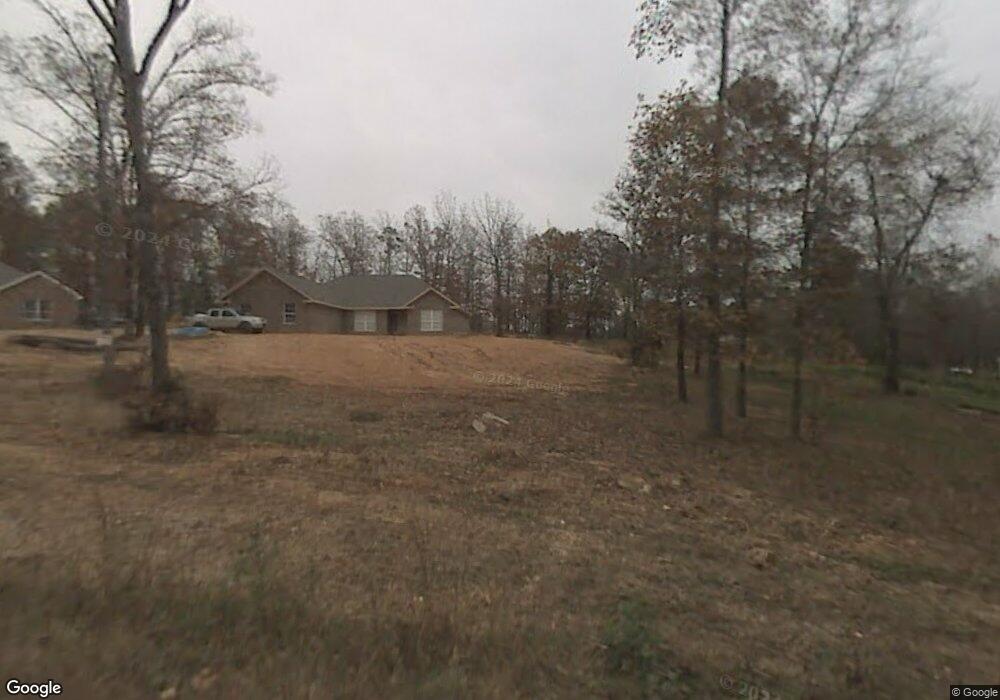
7324 Troup Rd Benton, AR 72019
Estimated Value: $243,028 - $345,000
--
Bed
2
Baths
1,641
Sq Ft
$188/Sq Ft
Est. Value
About This Home
This home is located at 7324 Troup Rd, Benton, AR 72019 and is currently estimated at $307,757, approximately $187 per square foot. 7324 Troup Rd is a home located in Saline County with nearby schools including Benton Middle School, Caldwell Elementary School, and Benton Junior High School.
Ownership History
Date
Name
Owned For
Owner Type
Purchase Details
Closed on
Jul 17, 2020
Sold by
Barlow Amber A and Barlow Christopher
Bought by
Barlow Amber and Barlow Christopher
Current Estimated Value
Home Financials for this Owner
Home Financials are based on the most recent Mortgage that was taken out on this home.
Original Mortgage
$149,600
Outstanding Balance
$105,933
Interest Rate
3.2%
Mortgage Type
New Conventional
Estimated Equity
$201,824
Purchase Details
Closed on
Jun 29, 2006
Sold by
Gundolf Robert S and Gundolf Marjorie
Bought by
Barlow Amber A
Home Financials for this Owner
Home Financials are based on the most recent Mortgage that was taken out on this home.
Original Mortgage
$150,000
Interest Rate
6.63%
Mortgage Type
Construction
Purchase Details
Closed on
Oct 6, 1995
Bought by
Robert
Purchase Details
Closed on
Aug 16, 1991
Bought by
Gundolf
Purchase Details
Closed on
Jul 1, 1991
Bought by
State Delq
Create a Home Valuation Report for This Property
The Home Valuation Report is an in-depth analysis detailing your home's value as well as a comparison with similar homes in the area
Home Values in the Area
Average Home Value in this Area
Purchase History
| Date | Buyer | Sale Price | Title Company |
|---|---|---|---|
| Barlow Amber | -- | Waco Title | |
| Barlow Amber A | $35,000 | -- | |
| Robert | $6,000 | -- | |
| Gundolf | -- | -- | |
| State Delq | -- | -- |
Source: Public Records
Mortgage History
| Date | Status | Borrower | Loan Amount |
|---|---|---|---|
| Open | Barlow Amber | $149,600 | |
| Closed | Barlow Amber A | $150,000 |
Source: Public Records
Tax History Compared to Growth
Tax History
| Year | Tax Paid | Tax Assessment Tax Assessment Total Assessment is a certain percentage of the fair market value that is determined by local assessors to be the total taxable value of land and additions on the property. | Land | Improvement |
|---|---|---|---|---|
| 2025 | $2,051 | $40,170 | $5,848 | $34,322 |
| 2024 | $2,051 | $40,170 | $5,848 | $34,322 |
| 2023 | $1,636 | $40,170 | $5,848 | $34,322 |
| 2022 | $1,597 | $40,170 | $5,848 | $34,322 |
| 2021 | $1,508 | $34,550 | $6,880 | $27,670 |
| 2020 | $1,458 | $34,550 | $6,880 | $27,670 |
| 2019 | $1,458 | $34,550 | $6,880 | $27,670 |
| 2018 | $1,467 | $34,550 | $6,880 | $27,670 |
| 2017 | $1,386 | $34,550 | $6,880 | $27,670 |
| 2016 | $1,606 | $31,120 | $6,880 | $24,240 |
| 2015 | $1,306 | $31,120 | $6,880 | $24,240 |
| 2014 | $1,656 | $31,120 | $6,880 | $24,240 |
Source: Public Records
Map
Nearby Homes
- 31 Ac. River Ridge Rd
- 1528 Brookshire Dr
- 522 Valley Hill Rd
- Lot 3 Abrielle Ln
- 1270 Fern Creek Dr
- 401 Kale Cove
- 301 Abrielle Ln
- 696 Mulberry Salem Rd
- 5947 Beth Ln
- 8616 Old Congo Rd
- 208 Clearview
- 2084 Mulberry Salem Rd
- 2173 N Fork Cir
- 1129 Essex Dr
- 1109 Essex Dr
- 2480 Holly Ridge Cove
- 2025 Seven Gables
- 925 Joyce Dr
- Lot 220 Bighorn Dr
- Lot 248 Bighorn Dr
- 7332 Troup Rd
- 0 Troup Rd
- 7250 Troup Rd
- 1309 Vanderbuilt Dr
- 7323 Troup Rd
- 1317 Vanderbuilt Dr
- 1301 Vanderbuilt Dr
- 1610 Vanderbuilt Cir
- 7224 Troup Rd
- 1300 Vanderbuilt Dr
- 7206 Troup Rd
- 0 Vanderbuilt Cir Unit 20039064
- 1314 Vanderbuilt Dr
- 1308 Vanderbuilt Dr
- 1325 Vanderbuilt Dr
- 0 Vanderbuilt Dr Unit 16003570
- 0 Vanderbuilt Dr Unit 20036646
- 0 Vanderbuilt Dr Unit 20035410
- 0 Vanderbuilt Dr Unit 20034867
- 0 Vanderbuilt Dr Unit 16036106