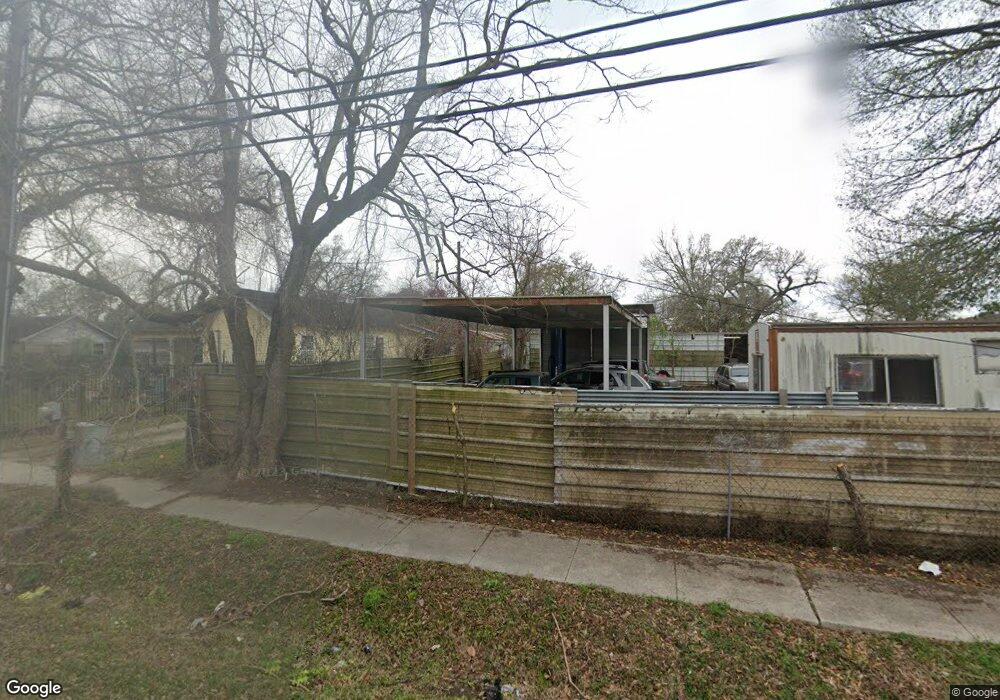
7325 Appleton St Unit 8 Houston, TX 77022
Northside-Northline NeighborhoodEstimated Value: $230,000
2
Beds
2
Baths
1,276
Sq Ft
$180/Sq Ft
Est. Value
About This Home
This home is located at 7325 Appleton St Unit 8, Houston, TX 77022 and is currently priced at $230,000, approximately $180 per square foot. 7325 Appleton St Unit 8 is a home located in Harris County with nearby schools including Herrera Elementary School, Burbank Middle School, and Sam Houston Math, Science & Technology Center.
Ownership History
Date
Name
Owned For
Owner Type
Purchase Details
Closed on
Mar 16, 2017
Sold by
Gallamore Pamela S
Bought by
Gallamore Pamela S and Gallamore Justin L
Current Estimated Value
Purchase Details
Closed on
Jul 6, 1999
Sold by
Simmons Russell and Sheets Robert D
Bought by
Jones Lester Clyde
Home Financials for this Owner
Home Financials are based on the most recent Mortgage that was taken out on this home.
Original Mortgage
$61,750
Outstanding Balance
$16,819
Interest Rate
7.21%
Mortgage Type
Commercial
Purchase Details
Closed on
Oct 30, 1995
Sold by
Russell Cheryl Arlene Killough and Russell Loren Ardean
Bought by
Russell Cheryl Arlene Killough
Purchase Details
Closed on
Nov 16, 1994
Sold by
Merchants Bank Houston
Bought by
Russell Loren and Russell Cheryl
Home Financials for this Owner
Home Financials are based on the most recent Mortgage that was taken out on this home.
Original Mortgage
$27,800
Interest Rate
8.88%
Mortgage Type
Seller Take Back
Create a Home Valuation Report for This Property
The Home Valuation Report is an in-depth analysis detailing your home's value as well as a comparison with similar homes in the area
Home Values in the Area
Average Home Value in this Area
Purchase History
| Date | Buyer | Sale Price | Title Company |
|---|---|---|---|
| Gallamore Pamela S | -- | None Available | |
| Jones Lester Clyde | -- | Chicago Title | |
| Russell Cheryl Arlene Killough | -- | -- | |
| Russell Loren | -- | -- |
Source: Public Records
Mortgage History
| Date | Status | Borrower | Loan Amount |
|---|---|---|---|
| Open | Jones Lester Clyde | $61,750 | |
| Previous Owner | Russell Loren | $27,800 |
Source: Public Records
Tax History
| Year | Tax Paid | Tax Assessment Tax Assessment Total Assessment is a certain percentage of the fair market value that is determined by local assessors to be the total taxable value of land and additions on the property. | Land | Improvement |
|---|---|---|---|---|
| 2025 | $6,947 | $414,994 | $182,300 | $232,694 |
| 2024 | $6,947 | $332,000 | $182,300 | $149,700 |
| 2023 | $6,947 | $430,761 | $182,300 | $248,461 |
| 2022 | $5,732 | $260,301 | $127,610 | $132,691 |
| 2021 | $5,422 | $232,639 | $127,610 | $105,029 |
| 2020 | $5,670 | $234,164 | $127,610 | $106,554 |
| 2019 | $5,452 | $215,453 | $91,150 | $124,303 |
| 2018 | $1,803 | $202,740 | $91,150 | $111,590 |
| 2017 | $4,749 | $198,935 | $91,150 | $107,785 |
| 2016 | $4,192 | $165,782 | $63,805 | $101,977 |
| 2015 | $1,698 | $166,279 | $63,805 | $102,474 |
| 2014 | $1,698 | $153,320 | $63,805 | $89,515 |
Source: Public Records
Map
Nearby Homes
- 428 Van Molan St
- 604 Yorkshire St
- 605 Post St
- 7206 Helmers St Unit A
- 7523 Roswell St
- 7115 Roswell St
- 7714 Helmers St
- 7009 Roswell St
- 720 Caperton St
- 525 Eubanks St
- 214 Palmyra St
- 0 Appleton St
- 7805 Farnsworth St Unit A/B
- 726 Mcdaniel St
- 118 Van Molan St
- 246 Rebecca St
- 620 Apache St
- 129 Garrotsville St
- 741 Mcdaniel St
- 164 Wallace St
- 7325 Appleton St
- 7321 Appleton St
- 7315 Appleton St
- 440 E Crosstimbers St
- 7313 Appleton St
- 436 E Crosstimbers St
- 7334 Appleton St
- 7336 Appleton St
- 7311 Appleton St
- 422 E Crosstimbers St
- 7324 Roswell St
- 7338 Appleton St
- 7320 Appleton St
- 7303 Appleton St
- 414 E Crosstimbers St
- 409 Littleton St
- 7310 Roswell St
- 407 Littleton St
- 408 E Crosstimbers St
- 521 Yorkshire St
Your Personal Tour Guide
Ask me questions while you tour the home.