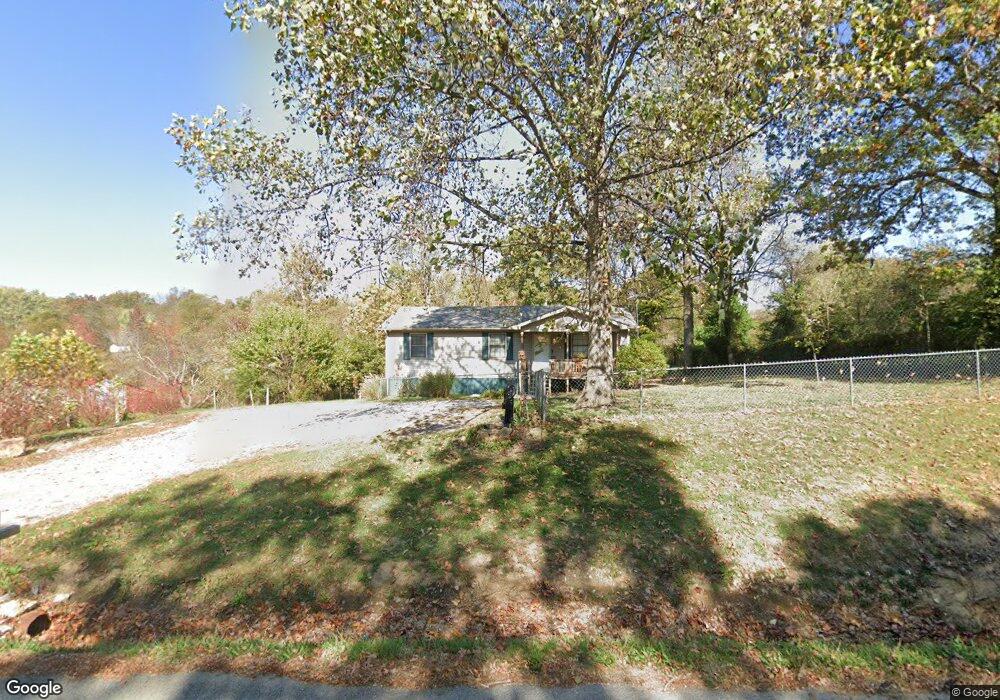
7325 Crossville Hwy Sparta, TN 38583
Estimated Value: $155,130 - $248,000
3
Beds
2
Baths
1,144
Sq Ft
$181/Sq Ft
Est. Value
About This Home
This home is located at 7325 Crossville Hwy, Sparta, TN 38583 and is currently estimated at $207,033, approximately $180 per square foot. 7325 Crossville Hwy is a home located in White County with nearby schools including Bon De Croft Elementary School, White County Middle School, and White County High School.
Ownership History
Date
Name
Owned For
Owner Type
Purchase Details
Closed on
Nov 15, 2007
Sold by
Vaughn Joey J
Bought by
Vaughn Tammy R
Current Estimated Value
Purchase Details
Closed on
May 17, 2004
Sold by
Leon Davenport
Bought by
Vaughn Tammy R
Home Financials for this Owner
Home Financials are based on the most recent Mortgage that was taken out on this home.
Original Mortgage
$60,100
Interest Rate
5.88%
Purchase Details
Closed on
Sep 25, 1998
Sold by
Ronnie Blaylock
Bought by
Leon Davenport
Purchase Details
Closed on
Nov 16, 1989
Bought by
Blaylock Ronnie and Blaylock Nellie
Purchase Details
Closed on
May 7, 1980
Bought by
Cobb Comer C and Cobb Barbara
Purchase Details
Closed on
Jan 1, 1980
Purchase Details
Closed on
Jan 2, 1900
Create a Home Valuation Report for This Property
The Home Valuation Report is an in-depth analysis detailing your home's value as well as a comparison with similar homes in the area
Home Values in the Area
Average Home Value in this Area
Purchase History
| Date | Buyer | Sale Price | Title Company |
|---|---|---|---|
| Vaughn Tammy R | -- | -- | |
| Vaughn Tammy R | $55,000 | -- | |
| Leon Davenport | $50,000 | -- | |
| Blaylock Ronnie | $1,300 | -- | |
| Cobb Comer C | -- | -- | |
| -- | $7,000 | -- | |
| -- | -- | -- |
Source: Public Records
Mortgage History
| Date | Status | Borrower | Loan Amount |
|---|---|---|---|
| Previous Owner | Not Available | $60,100 |
Source: Public Records
Tax History Compared to Growth
Tax History
| Year | Tax Paid | Tax Assessment Tax Assessment Total Assessment is a certain percentage of the fair market value that is determined by local assessors to be the total taxable value of land and additions on the property. | Land | Improvement |
|---|---|---|---|---|
| 2025 | $497 | $40,625 | $0 | $0 |
| 2024 | $497 | $24,250 | $3,250 | $21,000 |
| 2023 | $497 | $24,250 | $3,250 | $21,000 |
| 2022 | $497 | $24,250 | $3,250 | $21,000 |
| 2021 | $497 | $24,250 | $3,250 | $21,000 |
| 2020 | $497 | $24,250 | $3,250 | $21,000 |
| 2019 | $445 | $21,725 | $3,250 | $18,475 |
| 2018 | $445 | $21,725 | $3,250 | $18,475 |
| 2017 | $445 | $21,725 | $3,250 | $18,475 |
| 2016 | $445 | $21,725 | $3,250 | $18,475 |
| 2015 | $402 | $21,725 | $3,250 | $18,475 |
| 2014 | -- | $21,725 | $3,250 | $18,475 |
| 2013 | -- | $21,650 | $3,250 | $18,400 |
Source: Public Records
Map
Nearby Homes
- 6555 Crossville Hwy
- 245 Woolf Pass Ln
- 6232 Crossville Hwy
- 210 Kingwood Dr
- .23 ac Olen Ln
- 665 Camp Belle Air Rd
- 179 Holiday Ln
- 179 Holiday Lane Sparta Ln
- 214 Holiday Ln
- 8607 Crossville Hwy
- 8705 Crossville Hwy
- 296 Idlewild Dr
- 2897 Coal Bank Rd
- 5445 Coal Bank Rd
- 269 Moonlight Trail
- 852 Eastland Rd
- Lot 101 Rich Loop
- Lot 99 Rich Loop
- Lot 100 Rich Loop
- 500 Moonlight Trail
- 7361 Crossville Hwy
- 4388 Old Bon Air Rd
- 7401 Crossville Hwy
- 7193 Crossville Hwy
- 7443 Crossville Hwy
- 4288 Old Bon Air Rd
- 4221 Old Bon Air Rd
- 7511 Crossville Hwy
- 7070 Crossville Hwy
- 7099 Crossville Hwy
- 4132 Old Bon Air Rd
- 4132 Old Bon Air Rd
- 7431 Crossville Hwy
- 7595 Crossville Hwy
- 4100 Old Bon Air Rd
- 4100 Old Bonair Rd
- 7020 Crossville Hwy
- 6987 Crossville Hwy
- 6993 Crossville Hwy
- 6988 Crossville Hwy