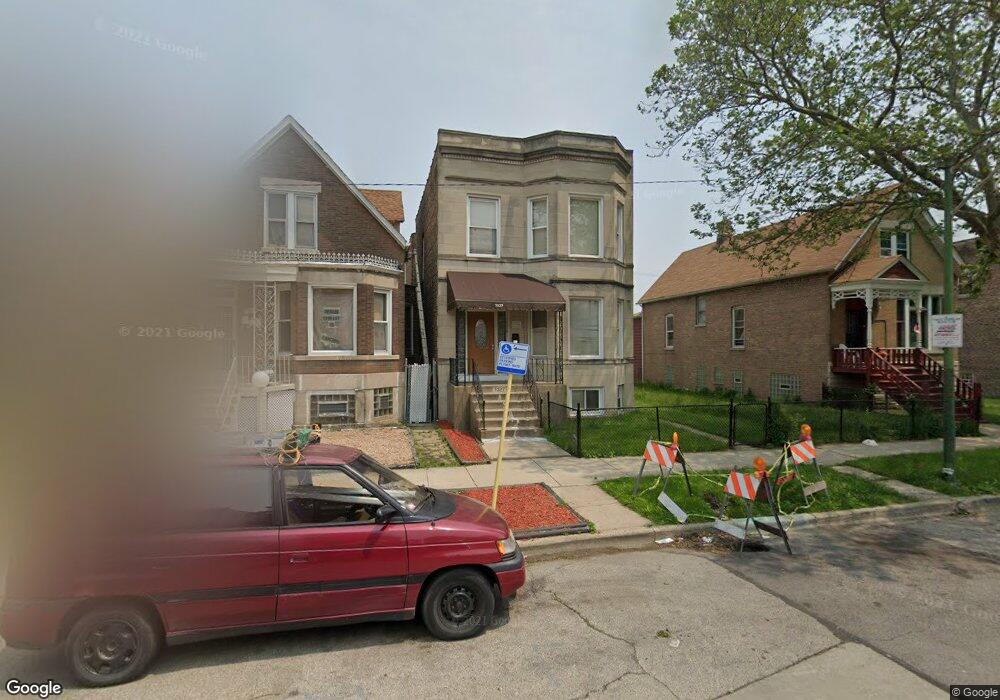
7327 S Champlain Ave Unit 1 Chicago, IL 60619
Park Manor NeighborhoodEstimated Value: $102,000 - $333,535
3
Beds
2
Baths
1,600
Sq Ft
$115/Sq Ft
Est. Value
About This Home
This home is located at 7327 S Champlain Ave Unit 1, Chicago, IL 60619 and is currently estimated at $183,634, approximately $114 per square foot. 7327 S Champlain Ave Unit 1 is a home located in Cook County with nearby schools including Tanner Elementary School, Emil G. Hirsch Metropolitan High School, and Gary Comer College Prep.
Ownership History
Date
Name
Owned For
Owner Type
Purchase Details
Closed on
Feb 20, 2019
Sold by
Blueprint Management Services Llc
Bought by
Blueprint Capital Investment Llc
Current Estimated Value
Purchase Details
Closed on
Aug 23, 2016
Sold by
Fnbn I Llc
Bought by
Blueprint Management Services Llc
Purchase Details
Closed on
Sep 24, 2012
Sold by
Hill Pearl and Hill Pearl L
Bought by
Fnbn I Llc
Purchase Details
Closed on
Jun 25, 2008
Sold by
Hill Pearl L and Bowen Gregory
Bought by
Chicago Inv Il Co and C H B Trust
Purchase Details
Closed on
Apr 30, 2007
Sold by
Precise Locations & Development Inc
Bought by
Hill Pearl
Home Financials for this Owner
Home Financials are based on the most recent Mortgage that was taken out on this home.
Original Mortgage
$242,100
Interest Rate
6.2%
Mortgage Type
Purchase Money Mortgage
Create a Home Valuation Report for This Property
The Home Valuation Report is an in-depth analysis detailing your home's value as well as a comparison with similar homes in the area
Home Values in the Area
Average Home Value in this Area
Purchase History
| Date | Buyer | Sale Price | Title Company |
|---|---|---|---|
| Blueprint Capital Investment Llc | -- | None Available | |
| Blueprint Management Services Llc | $1,000 | Attorney | |
| Fnbn I Llc | -- | None Available | |
| Chicago Inv Il Co | -- | None Available | |
| Hill Pearl | $269,000 | Lasalle Title |
Source: Public Records
Mortgage History
| Date | Status | Borrower | Loan Amount |
|---|---|---|---|
| Previous Owner | Hill Pearl | $242,100 |
Source: Public Records
Tax History
| Year | Tax Paid | Tax Assessment Tax Assessment Total Assessment is a certain percentage of the fair market value that is determined by local assessors to be the total taxable value of land and additions on the property. | Land | Improvement |
|---|---|---|---|---|
| 2025 | $527 | $8,454 | $1,406 | $7,048 |
| 2024 | $527 | $8,454 | $1,406 | $7,048 |
| 2023 | $514 | $2,500 | $1,250 | $1,250 |
| 2022 | $514 | $2,500 | $1,250 | $1,250 |
| 2021 | $503 | $2,499 | $1,249 | $1,250 |
| 2020 | $2,392 | $10,737 | $1,952 | $8,785 |
| 2019 | $2,392 | $11,904 | $1,952 | $9,952 |
| 2018 | $2,351 | $11,904 | $1,952 | $9,952 |
| 2017 | $2,332 | $10,833 | $1,718 | $9,115 |
| 2016 | $2,170 | $10,833 | $1,718 | $9,115 |
| 2015 | $1,985 | $10,833 | $1,718 | $9,115 |
| 2014 | $2,035 | $10,970 | $1,405 | $9,565 |
| 2013 | $1,995 | $10,970 | $1,405 | $9,565 |
Source: Public Records
Map
Nearby Homes
- 7352 S Langley Ave
- 7356 S Champlain Ave
- 7250 S Langley Ave
- 7240 S Langley Ave
- 7410 S Langley Ave
- 7405 S Saint Lawrence Ave
- 7237 S Saint Lawrence Ave
- 7415 S Langley Ave
- 7339 S Evans Ave
- 7225 S Langley Ave
- 7225 S Saint Lawrence Ave
- 7436 S Langley Ave
- 7431 S Saint Lawrence Ave
- 7438 S Champlain Ave
- 7214 S Saint Lawrence Ave
- 7459 S Champlain Ave
- 7305 S Eberhart Ave
- 706 E 72nd St
- 814 E 74th St
- 7340 S Maryland Ave
- 7327 S Champlain Ave Unit 2
- 7325 S Champlain Ave
- 7321 S Champlain Ave Unit 1
- 7321 S Champlain Ave Unit 2
- 7321 S Champlain Ave
- 7321 S Champlain Ave
- 7331 S Champlain Ave
- 7319 S Champlain Ave
- 7319 S Champlain Ave
- 7317 S Champlain Ave
- 7337 S Champlain Ave
- 7329 S Champlain Ave
- 7311 S Champlain Ave
- 7311 S Champlain Ave Unit 2R
- 7339 S Champlain Ave
- 7324 S Champlain Ave
- 7341 S Champlain Ave
- 7326 S Langley Ave
- 7318 S Champlain Ave
- 7309 S Champlain Ave
Your Personal Tour Guide
Ask me questions while you tour the home.