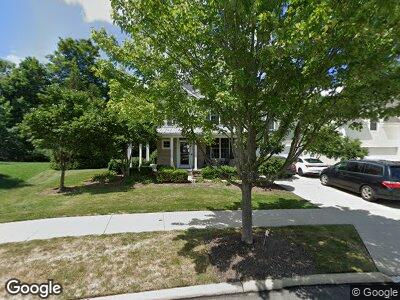
7328 Glenwillow Place Solon, OH 44139
Glenwillow NeighborhoodEstimated Value: $403,000 - $530,000
4
Beds
3
Baths
2,500
Sq Ft
$187/Sq Ft
Est. Value
About This Home
This home is located at 7328 Glenwillow Place, Solon, OH 44139 and is currently estimated at $466,275, approximately $186 per square foot. 7328 Glenwillow Place is a home located in Cuyahoga County with nearby schools including Orchard Middle School, Solon Middle School, and Solon High School.
Ownership History
Date
Name
Owned For
Owner Type
Purchase Details
Closed on
Jun 28, 2018
Sold by
Marine Rebecca A and Marine Charles M
Bought by
Patel Darshakkumar and Patel H
Current Estimated Value
Home Financials for this Owner
Home Financials are based on the most recent Mortgage that was taken out on this home.
Original Mortgage
$250,400
Interest Rate
4.6%
Mortgage Type
New Conventional
Purchase Details
Closed on
Feb 13, 2006
Sold by
Whitlatch & Co
Bought by
Marine Charles M and Marine Rebecca A
Home Financials for this Owner
Home Financials are based on the most recent Mortgage that was taken out on this home.
Original Mortgage
$275,000
Interest Rate
6.2%
Mortgage Type
Purchase Money Mortgage
Create a Home Valuation Report for This Property
The Home Valuation Report is an in-depth analysis detailing your home's value as well as a comparison with similar homes in the area
Home Values in the Area
Average Home Value in this Area
Purchase History
| Date | Buyer | Sale Price | Title Company |
|---|---|---|---|
| Patel Darshakkumar | $313,000 | Nova Title Agency Inc | |
| Marine Charles M | $371,483 | General Title Agency |
Source: Public Records
Mortgage History
| Date | Status | Borrower | Loan Amount |
|---|---|---|---|
| Open | Patel Darshakkumar H | $254,250 | |
| Closed | Patel Darshakkumar | $252,000 | |
| Closed | Patel Darshakkumar | $250,400 | |
| Previous Owner | Marine Charles | $35,000 | |
| Previous Owner | Marine Charles M | $5,000 | |
| Previous Owner | Marine Charles M | $275,000 |
Source: Public Records
Tax History Compared to Growth
Tax History
| Year | Tax Paid | Tax Assessment Tax Assessment Total Assessment is a certain percentage of the fair market value that is determined by local assessors to be the total taxable value of land and additions on the property. | Land | Improvement |
|---|---|---|---|---|
| 2024 | $8,871 | $162,750 | $34,090 | $128,660 |
| 2023 | $7,301 | $109,560 | $25,660 | $83,900 |
| 2022 | $7,285 | $109,550 | $25,660 | $83,900 |
| 2021 | $7,202 | $109,550 | $25,660 | $83,900 |
| 2020 | $7,875 | $109,550 | $24,330 | $85,230 |
| 2019 | $7,626 | $313,000 | $69,500 | $243,500 |
| 2018 | $6,740 | $109,550 | $24,330 | $85,230 |
| 2017 | $7,271 | $119,110 | $23,100 | $96,010 |
| 2016 | $7,202 | $119,110 | $23,100 | $96,010 |
| 2015 | $7,157 | $119,110 | $23,100 | $96,010 |
| 2014 | $7,157 | $114,530 | $22,230 | $92,300 |
Source: Public Records
Map
Nearby Homes
- 7346 Richmond Rd
- 26240 Broadway Ave Unit 25
- 10028 Deerfield Ct
- 9970 Forest Lake Dr
- 7366 Cromwell Dr
- 25911 Tryon Rd
- 9781 Parkland Dr
- 32877 Seneca Dr
- 32959 Charmwood Oval
- 25839 Garden Rd
- 9878 Ridgewood Dr
- 32929 Ashdown Dr
- 9791 Shepard Rd
- 7220 Blackwell Dr
- 1926 Glenwood Dr
- 33165 Popham Ln
- 2127 Demi Dr
- 25686 Buckthorn Rd
- 25644 Buckthorn Rd
- 25602 Buckthorn Rd