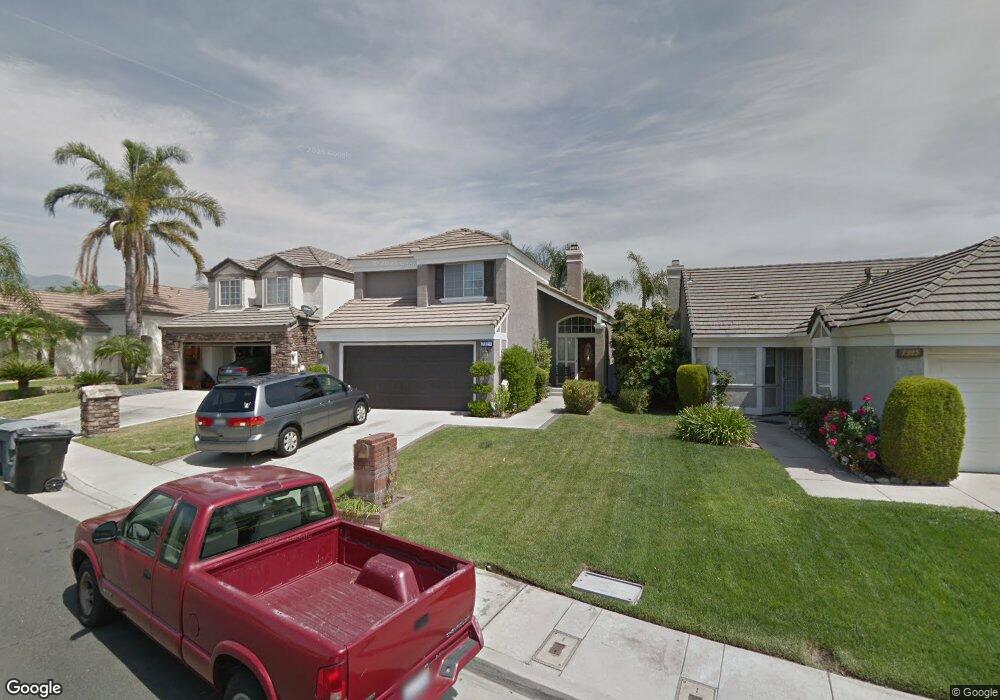
7329 Cascade Ct Rancho Cucamonga, CA 91730
Terra Vista NeighborhoodEstimated Value: $724,000 - $764,000
3
Beds
2
Baths
1,438
Sq Ft
$512/Sq Ft
Est. Value
About This Home
This home is located at 7329 Cascade Ct, Rancho Cucamonga, CA 91730 and is currently estimated at $735,911, approximately $511 per square foot. 7329 Cascade Ct is a home located in San Bernardino County with nearby schools including Ruth Musser Middle, Coyote Canyon Elementary, and Rancho Cucamonga High School.
Ownership History
Date
Name
Owned For
Owner Type
Purchase Details
Closed on
Sep 23, 2005
Sold by
Duncan John H
Bought by
Duncan John H and Duncan Teresa M
Current Estimated Value
Purchase Details
Closed on
Jul 19, 2005
Sold by
Pizano Teresa M
Bought by
Duncan John H
Home Financials for this Owner
Home Financials are based on the most recent Mortgage that was taken out on this home.
Original Mortgage
$89,000
Interest Rate
5.46%
Mortgage Type
Balloon
Purchase Details
Closed on
Jul 11, 2005
Sold by
Lafferty Sean Patrick and Lafferty Mary Elizabeth
Bought by
Duncan John H
Home Financials for this Owner
Home Financials are based on the most recent Mortgage that was taken out on this home.
Original Mortgage
$89,000
Interest Rate
5.46%
Mortgage Type
Balloon
Purchase Details
Closed on
Jun 20, 2001
Sold by
Allas Roberto R and Allas Carolyn D
Bought by
Lafferty Sean Patrick and Lafferty Mary Elizabeth
Home Financials for this Owner
Home Financials are based on the most recent Mortgage that was taken out on this home.
Original Mortgage
$177,219
Interest Rate
7.21%
Mortgage Type
FHA
Create a Home Valuation Report for This Property
The Home Valuation Report is an in-depth analysis detailing your home's value as well as a comparison with similar homes in the area
Home Values in the Area
Average Home Value in this Area
Purchase History
| Date | Buyer | Sale Price | Title Company |
|---|---|---|---|
| Duncan John H | -- | Investors Title | |
| Duncan John H | -- | Commonwealth Land Title Co | |
| Duncan John H | $445,000 | Commonwealth Land Title Co | |
| Lafferty Sean Patrick | $180,000 | Orange Coast Title |
Source: Public Records
Mortgage History
| Date | Status | Borrower | Loan Amount |
|---|---|---|---|
| Closed | Duncan John H | $89,000 | |
| Open | Duncan John H | $356,000 | |
| Previous Owner | Lafferty Sean Patrick | $177,219 |
Source: Public Records
Tax History
| Year | Tax Paid | Tax Assessment Tax Assessment Total Assessment is a certain percentage of the fair market value that is determined by local assessors to be the total taxable value of land and additions on the property. | Land | Improvement |
|---|---|---|---|---|
| 2025 | $7,337 | $608,132 | $152,033 | $456,099 |
| 2024 | $7,133 | $596,208 | $149,052 | $447,156 |
| 2023 | $6,959 | $584,517 | $146,129 | $438,388 |
| 2022 | $6,826 | $573,056 | $143,264 | $429,792 |
| 2021 | $6,434 | $527,000 | $184,000 | $343,000 |
| 2020 | $5,818 | $480,900 | $168,400 | $312,500 |
| 2019 | $5,740 | $466,900 | $163,500 | $303,400 |
| 2018 | $5,695 | $466,900 | $163,500 | $303,400 |
| 2017 | $5,341 | $434,300 | $152,100 | $282,200 |
| 2016 | $5,169 | $413,700 | $144,900 | $268,800 |
| 2015 | $4,958 | $394,000 | $138,000 | $256,000 |
| 2014 | $4,651 | $371,000 | $130,000 | $241,000 |
Source: Public Records
Map
Nearby Homes
- 7373 Glenview Place
- 11159 Saint Tropez Dr
- 11213 Terra Vista Pkwy Unit D
- 7545 Calais Ct
- 11090 Mountain View Dr Unit 74
- 10751 Spyglass Dr
- 11261 Terra Vista Pkwy
- 7323 Ambrosia Rd
- 7297 Meadowlark Place
- 7004 Beal Ct
- 7407 Ambrosia Rd
- 7034 Mendocino Place
- 11224 Amarillo St
- 7353 Ellena W Unit 70
- 7353 Ellena W Unit 64
- 7353 Ellena W Unit 83
- 7353 Ellena W
- 7523 Wellington Place
- 11320 Genova Rd
- 10634 Countryside Dr
- 7335 Cascade Ct
- 7323 Cascade Ct
- 7341 Cascade Ct
- 7317 Cascade Ct
- 7334 Birkdale Place
- 7340 Birkdale Place
- 7347 Cascade Ct
- 7346 Birkdale Place
- 11046 Canterbury Ct
- 7328 Cascade Ct
- 7334 Cascade Ct
- 7322 Cascade Ct
- 7340 Cascade Ct
- 7316 Cascade Ct
- 7352 Birkdale Place
- 7346 Cascade Ct
- 7359 Cascade Ct
- 7358 Birkdale Place
- 11052 Canterbury Ct
- 7352 Cascade Ct
Your Personal Tour Guide
Ask me questions while you tour the home.