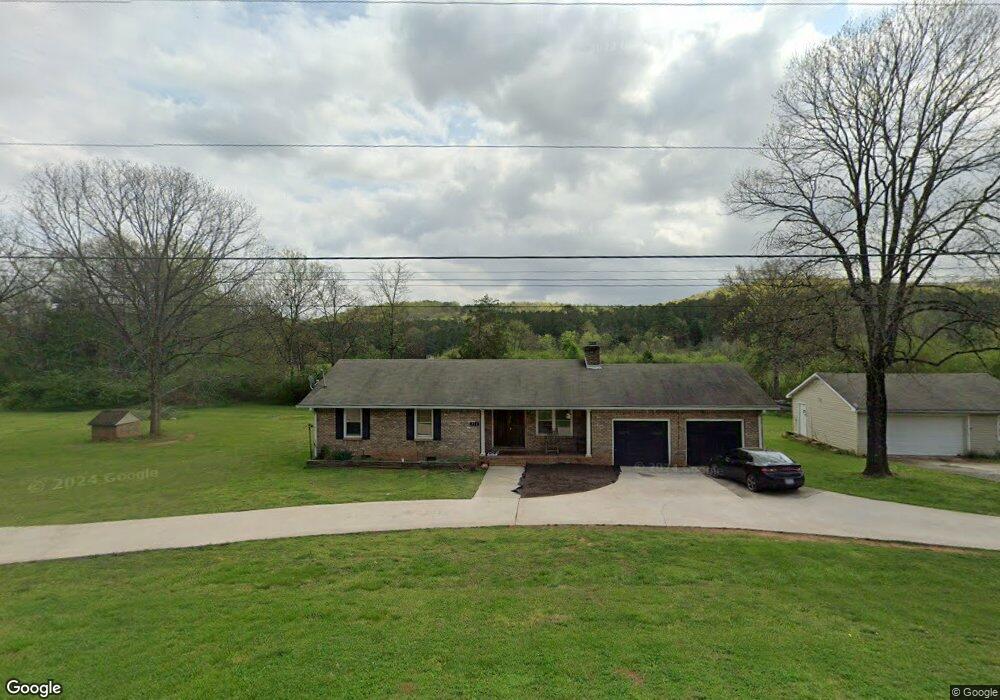
733 Booger Hollow Rd SW Lindale, GA 30147
Estimated Value: $230,030 - $256,000
3
Beds
2
Baths
1,233
Sq Ft
$194/Sq Ft
Est. Value
About This Home
This home is located at 733 Booger Hollow Rd SW, Lindale, GA 30147 and is currently estimated at $239,508, approximately $194 per square foot. 733 Booger Hollow Rd SW is a home located in Floyd County with nearby schools including Pepperell Middle School and Pepperell High School.
Ownership History
Date
Name
Owned For
Owner Type
Purchase Details
Closed on
May 25, 2011
Sold by
Casteel Lillie Ingram
Bought by
Smith James E
Current Estimated Value
Home Financials for this Owner
Home Financials are based on the most recent Mortgage that was taken out on this home.
Original Mortgage
$116,843
Outstanding Balance
$80,863
Interest Rate
4.79%
Mortgage Type
New Conventional
Estimated Equity
$158,645
Purchase Details
Closed on
Jan 4, 2006
Sold by
Barton Shirley Ingram N and Barton K
Bought by
Ingram Casteel and K Ussery H
Purchase Details
Closed on
May 8, 1993
Sold by
Ussery H K Ms
Bought by
Shirley Ussery H and Shirley Ingram Bart
Purchase Details
Closed on
Nov 30, 1988
Sold by
Kelley Kelley S and Kelley Casteel L
Bought by
Ussery H K Ms
Purchase Details
Closed on
Nov 20, 1986
Sold by
Ingram Mrs Hilda
Bought by
Kelley Kelley S and Kelley Casteel L
Purchase Details
Closed on
Jan 5, 1957
Bought by
Ingram Mrs Hilda
Create a Home Valuation Report for This Property
The Home Valuation Report is an in-depth analysis detailing your home's value as well as a comparison with similar homes in the area
Home Values in the Area
Average Home Value in this Area
Purchase History
| Date | Buyer | Sale Price | Title Company |
|---|---|---|---|
| Smith James E | $112,755 | -- | |
| Ingram Casteel | -- | -- | |
| Shirley Ussery H | -- | -- | |
| Ussery H K Ms | -- | -- | |
| Kelley Kelley S | -- | -- | |
| Ingram Mrs Hilda | -- | -- |
Source: Public Records
Mortgage History
| Date | Status | Borrower | Loan Amount |
|---|---|---|---|
| Open | Smith James E | $116,843 |
Source: Public Records
Tax History Compared to Growth
Tax History
| Year | Tax Paid | Tax Assessment Tax Assessment Total Assessment is a certain percentage of the fair market value that is determined by local assessors to be the total taxable value of land and additions on the property. | Land | Improvement |
|---|---|---|---|---|
| 2024 | $2,364 | $77,031 | $6,679 | $70,352 |
| 2023 | $2,204 | $74,742 | $6,072 | $68,670 |
| 2022 | $1,854 | $62,493 | $4,817 | $57,676 |
| 2021 | $1,444 | $47,850 | $4,382 | $43,468 |
| 2020 | $1,397 | $45,905 | $3,810 | $42,095 |
| 2019 | $1,335 | $44,442 | $3,810 | $40,632 |
| 2018 | $1,287 | $42,773 | $3,629 | $39,144 |
| 2017 | $1,260 | $41,790 | $3,360 | $38,430 |
| 2016 | $1,186 | $38,874 | $3,360 | $35,514 |
| 2015 | $1,160 | $38,874 | $3,360 | $35,514 |
| 2014 | $1,160 | $38,874 | $3,360 | $35,514 |
Source: Public Records
Map
Nearby Homes
- 849 Booger Hollow Rd SW
- 0 Booger Hollow Rd SW Unit 17969096
- 938 Marion Dairy Rd
- 5165 Cave Spring Rd SW
- 185 Marion Dairy Rd SE
- 5854 Cedartown Hwy SW
- 0 College View Dr SW Unit 10655489
- 0 College View Dr SW Unit 10655483
- 5866 Hwy 27 S
- 3667 Cave Spring Rd SW
- 4365 Cave Spring Rd SW
- 514 Booze Mountain Rd SE
- 0 Oakmont Dr SW Unit 10648261
- 0 Booger Hollow Rd
- 4 The Trail SE
- 184 Conns Lake Extension
- 1380 Old Cedartown Rd SE
- 0 Vanns Valley Rd SW Unit 7589183
- 0 Vanns Valley Rd SW Unit 10534224
- 65 Vanns Valley Rd SW
- 728 Booger Hollow Rd SW
- 748 Booger Hollow Rd SW
- 691 Booger Hollow Rd SW
- 691 Booger Hollow Rd SW
- 788 Booger Hollow Rd SW
- 797 Booger Hollow Rd SW
- 823 Booger Hollow Rd SW
- 12 Lumpkin Rd SW
- 88 Lumpkin Rd SW
- 150 Lumpkin Rd SW
- 799 Booger Hollow Rd SW
- 130 Lumpkin Rd SW
- 866 Booger Hollow Rd SW
- 883 Booger Hollow Rd SW
- 899 Booger Hollow Rd SW
- 899 Booger Hollow Rd SW
- 878 Booger Hollow Rd SW
- 916 Booger Hollow Rd SW
- 912 Booger Hollow Rd SW
- 902 Booger Hollow Rd SW