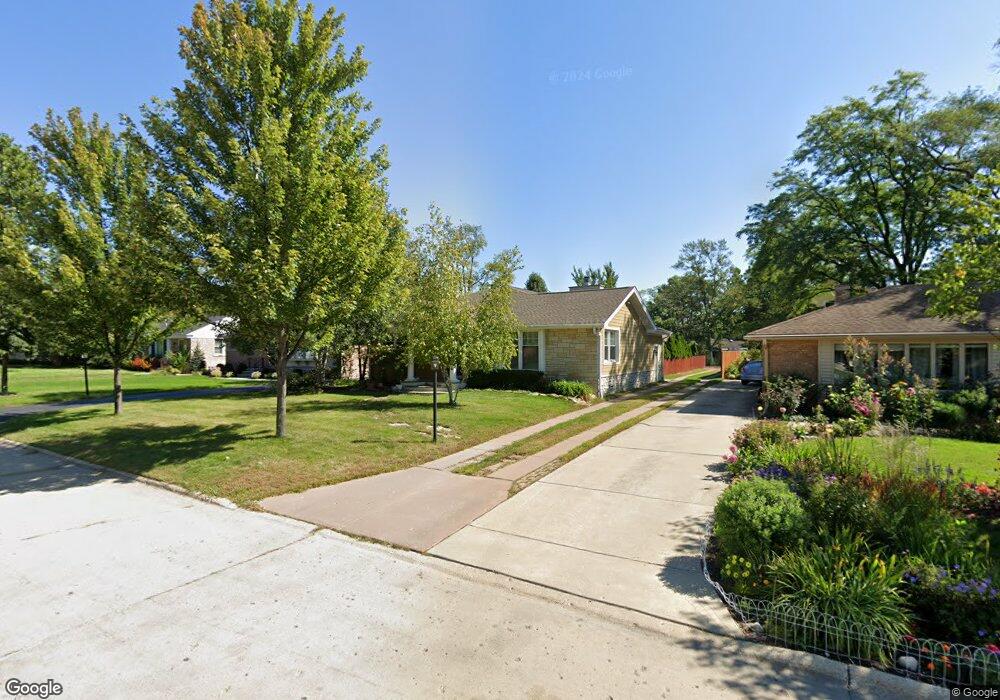
733 Elmgate Dr Glenview, IL 60025
Estimated Value: $663,000 - $909,901
3
Beds
4
Baths
2,119
Sq Ft
$380/Sq Ft
Est. Value
About This Home
This home is located at 733 Elmgate Dr, Glenview, IL 60025 and is currently estimated at $805,475, approximately $380 per square foot. 733 Elmgate Dr is a home located in Cook County with nearby schools including Hoffman Elementary School, Henking Elementary School, and Springman Middle School.
Ownership History
Date
Name
Owned For
Owner Type
Purchase Details
Closed on
Jul 22, 2004
Sold by
Karski Alexander
Bought by
Prystash Nataliya
Current Estimated Value
Home Financials for this Owner
Home Financials are based on the most recent Mortgage that was taken out on this home.
Original Mortgage
$308,750
Outstanding Balance
$168,132
Interest Rate
7.62%
Mortgage Type
Unknown
Estimated Equity
$637,343
Purchase Details
Closed on
Mar 31, 2004
Sold by
Nickele Joseph A and Nickele Katherine A
Bought by
Karski Alexander
Purchase Details
Closed on
Sep 27, 2001
Sold by
Krall Helen J
Bought by
Nickele Joseph A and Nickele Katherine A
Home Financials for this Owner
Home Financials are based on the most recent Mortgage that was taken out on this home.
Original Mortgage
$190,000
Interest Rate
6.99%
Create a Home Valuation Report for This Property
The Home Valuation Report is an in-depth analysis detailing your home's value as well as a comparison with similar homes in the area
Home Values in the Area
Average Home Value in this Area
Purchase History
| Date | Buyer | Sale Price | Title Company |
|---|---|---|---|
| Prystash Nataliya | $325,000 | Pntn | |
| Karski Alexander | $270,000 | -- | |
| Nickele Joseph A | $275,000 | -- |
Source: Public Records
Mortgage History
| Date | Status | Borrower | Loan Amount |
|---|---|---|---|
| Open | Prystash Nataliya | $308,750 | |
| Previous Owner | Nickele Joseph A | $190,000 |
Source: Public Records
Tax History Compared to Growth
Tax History
| Year | Tax Paid | Tax Assessment Tax Assessment Total Assessment is a certain percentage of the fair market value that is determined by local assessors to be the total taxable value of land and additions on the property. | Land | Improvement |
|---|---|---|---|---|
| 2024 | $14,387 | $58,662 | $18,528 | $40,134 |
| 2023 | $13,981 | $65,000 | $18,528 | $46,472 |
| 2022 | $13,981 | $65,000 | $18,528 | $46,472 |
| 2021 | $14,852 | $59,674 | $14,185 | $45,489 |
| 2020 | $14,677 | $59,674 | $14,185 | $45,489 |
| 2019 | $13,678 | $65,576 | $14,185 | $51,391 |
| 2018 | $13,079 | $56,866 | $12,448 | $44,418 |
| 2017 | $12,730 | $56,866 | $12,448 | $44,418 |
| 2016 | $9,759 | $46,137 | $12,448 | $33,689 |
| 2015 | $8,717 | $36,604 | $10,132 | $26,472 |
| 2014 | $8,557 | $36,604 | $10,132 | $26,472 |
| 2013 | $8,296 | $36,604 | $10,132 | $26,472 |
Source: Public Records
Map
Nearby Homes
- 1088 Shermer Rd Unit DW
- 517 Briarhill Ln
- 2137 Glenview Rd
- 2700 Fontana Dr
- 2821 Covert Rd
- 521 Michael Manor
- 316 Nellie Ct
- 2121 Fir St
- 216 Flora Ave
- 2740 Norma Ct
- 137 Julie Dr
- 203 Valerie Ct
- 315 Lincoln St
- 2750 Langley Cir Unit 203013
- 1821 George Ct
- 1800 Dewes St Unit 305
- 1800 Dewes St Unit 201
- 1800 Dewes St Unit 309
- 51 James Ct
- 1045 Crystal Ct