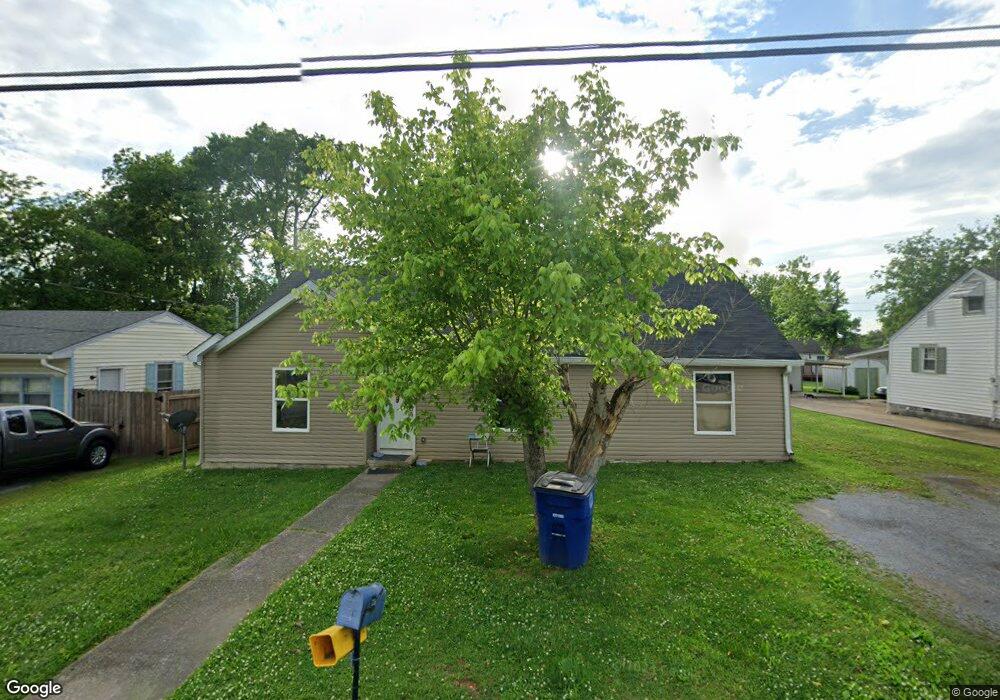
733 Hoover St Shelbyville, TN 37160
Estimated Value: $208,000 - $253,000
--
Bed
1
Bath
1,403
Sq Ft
$171/Sq Ft
Est. Value
About This Home
This home is located at 733 Hoover St, Shelbyville, TN 37160 and is currently estimated at $239,470, approximately $170 per square foot. 733 Hoover St is a home located in Bedford County with nearby schools including Harris Middle School and Victory Baptist Academy.
Ownership History
Date
Name
Owned For
Owner Type
Purchase Details
Closed on
Nov 1, 2016
Sold by
Calabrese Mitchell
Bought by
Farrar James E
Current Estimated Value
Purchase Details
Closed on
Aug 8, 2013
Sold by
Parker Kenneth
Bought by
Calabrese Mitchell
Home Financials for this Owner
Home Financials are based on the most recent Mortgage that was taken out on this home.
Original Mortgage
$15,000
Interest Rate
4.48%
Mortgage Type
Commercial
Purchase Details
Closed on
Aug 25, 2006
Sold by
Boyce Gary
Bought by
Parker Kenneth
Home Financials for this Owner
Home Financials are based on the most recent Mortgage that was taken out on this home.
Original Mortgage
$91,200
Interest Rate
6.67%
Purchase Details
Closed on
Dec 13, 2001
Sold by
Overcast Larry
Bought by
Boyce Gary and Boyce Wendy
Purchase Details
Closed on
Sep 27, 1947
Bought by
Overcast Joe M and Overcast Juanita
Create a Home Valuation Report for This Property
The Home Valuation Report is an in-depth analysis detailing your home's value as well as a comparison with similar homes in the area
Home Values in the Area
Average Home Value in this Area
Purchase History
| Date | Buyer | Sale Price | Title Company |
|---|---|---|---|
| Farrar James E | $25,000 | -- | |
| Calabrese Mitchell | $7,400 | -- | |
| Parker Kenneth | $44,325 | -- | |
| Boyce Gary | $34,250 | -- | |
| Overcast Joe M | -- | -- |
Source: Public Records
Mortgage History
| Date | Status | Borrower | Loan Amount |
|---|---|---|---|
| Previous Owner | Calabrese Mitchell | $15,000 | |
| Previous Owner | Overcast Joe M | $91,200 |
Source: Public Records
Tax History Compared to Growth
Tax History
| Year | Tax Paid | Tax Assessment Tax Assessment Total Assessment is a certain percentage of the fair market value that is determined by local assessors to be the total taxable value of land and additions on the property. | Land | Improvement |
|---|---|---|---|---|
| 2025 | -- | $38,100 | $0 | $0 |
| 2024 | -- | $38,100 | $4,500 | $33,600 |
| 2023 | $564 | $38,100 | $4,500 | $33,600 |
| 2022 | $1,482 | $37,850 | $4,500 | $33,350 |
| 2021 | $1,346 | $37,850 | $4,500 | $33,350 |
| 2020 | $1,167 | $37,850 | $4,500 | $33,350 |
| 2019 | $1,167 | $26,350 | $2,250 | $24,100 |
| 2018 | $1,141 | $26,350 | $2,250 | $24,100 |
| 2017 | $98 | $2,250 | $2,250 | $0 |
| 2016 | $97 | $2,250 | $2,250 | $0 |
| 2015 | $97 | $2,250 | $2,250 | $0 |
| 2014 | $56 | $1,425 | $0 | $0 |
Source: Public Records
Map
Nearby Homes
- 724 Alton Ave
- 714 King Ave
- 636 Deery St
- 713 King Ave
- 703 Deery St
- 527 Deery St
- 216 Celebration St
- 112 E Cedar St
- 610 Sundance St
- 0 Hilltop Rd Unit RTC2897754
- 0 Hilltop Rd Unit RTC3001632
- 464 Whitthorne St
- 1017 Fairfield Pike
- 178 Lucas Rd
- 627 E Lane St
- 631 E Lane St
- 117 Blue Ribbon Pkwy
- 304 Lee Ln
- 134 Butler St
- 303 Lee Ln