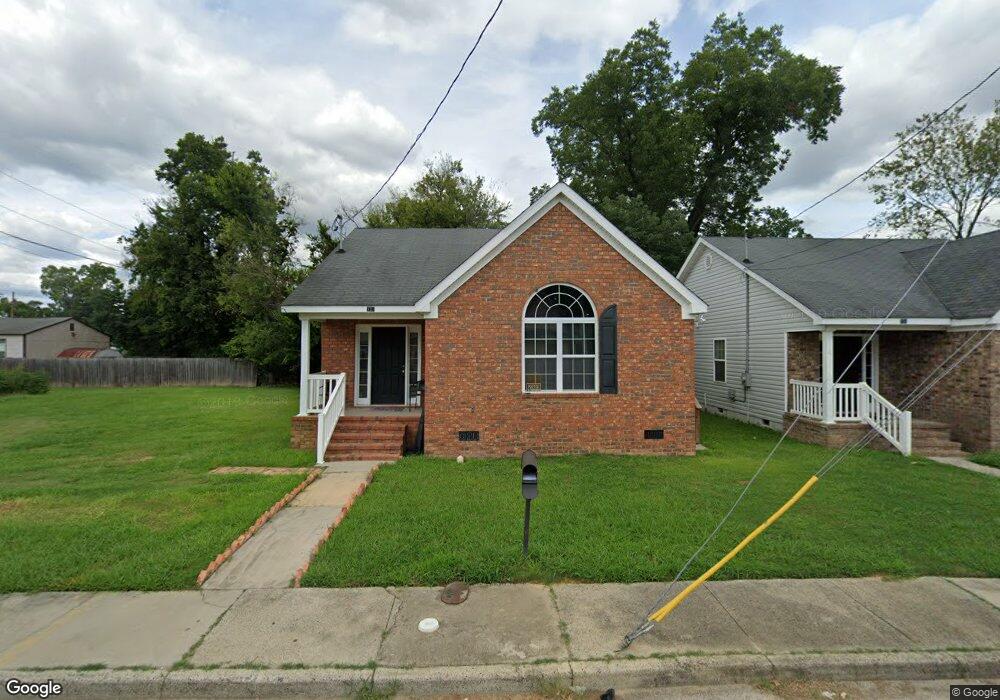
733 Hopkins St Augusta, GA 30901
Laney Walker NeighborhoodEstimated Value: $98,000 - $158,000
2
Beds
2
Baths
1,299
Sq Ft
$100/Sq Ft
Est. Value
About This Home
This home is located at 733 Hopkins St, Augusta, GA 30901 and is currently estimated at $130,521, approximately $100 per square foot. 733 Hopkins St is a home located in Richmond County with nearby schools including W.S. Hornsby School, W.S. Hornsby Elementary School, and Johnson Magnet.
Ownership History
Date
Name
Owned For
Owner Type
Purchase Details
Closed on
Jul 15, 2010
Sold by
Queensborough Natl Bk & Trust
Bought by
Cooper Robert
Current Estimated Value
Purchase Details
Closed on
Mar 2, 2010
Sold by
Allen L Collier Ent Inc
Bought by
Queensborough Natl Bk & Trust
Purchase Details
Closed on
Mar 9, 1999
Sold by
Simpkins Roosevelt and Simpkins Willie W
Bought by
Estate Of Willoughby C Robinson Simpkins
Create a Home Valuation Report for This Property
The Home Valuation Report is an in-depth analysis detailing your home's value as well as a comparison with similar homes in the area
Home Values in the Area
Average Home Value in this Area
Purchase History
| Date | Buyer | Sale Price | Title Company |
|---|---|---|---|
| Cooper Robert | $31,400 | -- | |
| Queensborough Natl Bk & Trust | $84,217 | -- | |
| Estate Of Willoughby C Robinson Simpkins | -- | -- |
Source: Public Records
Tax History Compared to Growth
Tax History
| Year | Tax Paid | Tax Assessment Tax Assessment Total Assessment is a certain percentage of the fair market value that is determined by local assessors to be the total taxable value of land and additions on the property. | Land | Improvement |
|---|---|---|---|---|
| 2025 | $2,114 | $59,796 | $6,000 | $53,796 |
| 2024 | $2,114 | $48,544 | $6,000 | $42,544 |
| 2023 | $1,721 | $52,920 | $6,000 | $46,920 |
| 2022 | $1,820 | $49,352 | $6,000 | $43,352 |
| 2021 | $1,578 | $37,730 | $6,000 | $31,730 |
| 2020 | $1,557 | $37,730 | $6,000 | $31,730 |
| 2019 | $1,648 | $37,768 | $6,000 | $31,768 |
| 2018 | $1,660 | $37,768 | $6,000 | $31,768 |
| 2017 | $1,652 | $37,768 | $6,000 | $31,768 |
| 2016 | $1,653 | $37,768 | $6,000 | $31,768 |
| 2015 | $1,663 | $37,768 | $6,000 | $31,768 |
| 2014 | $1,664 | $37,768 | $6,000 | $31,768 |
Source: Public Records
Map
Nearby Homes