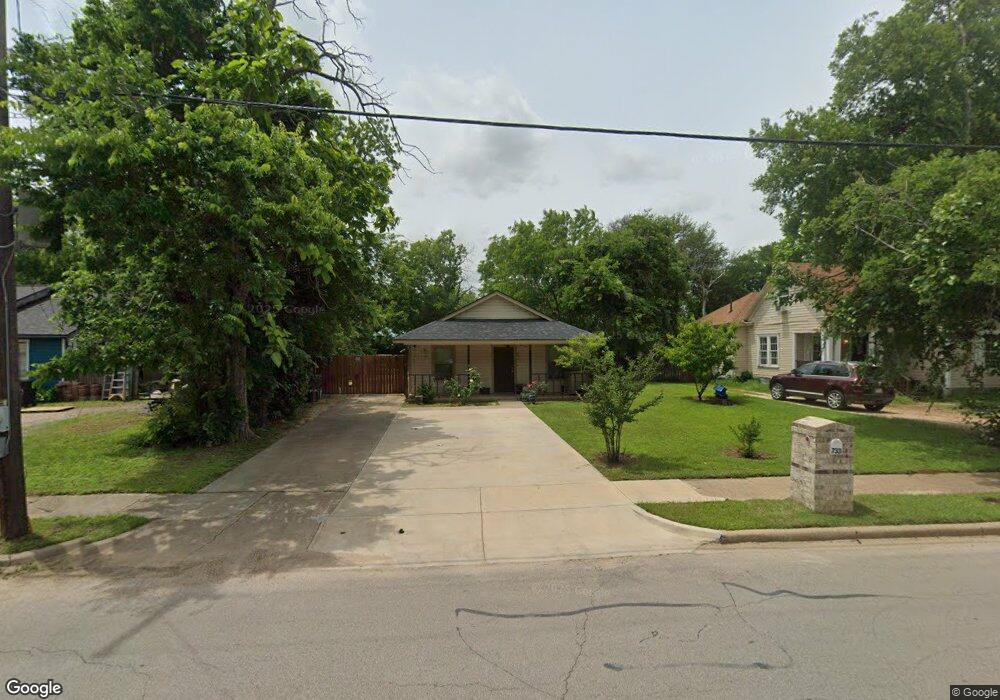
733 N Anglin St Cleburne, TX 76031
Estimated Value: $196,223 - $221,000
3
Beds
2
Baths
1,144
Sq Ft
$182/Sq Ft
Est. Value
About This Home
This home is located at 733 N Anglin St, Cleburne, TX 76031 and is currently estimated at $208,056, approximately $181 per square foot. 733 N Anglin St is a home located in Johnson County with nearby schools including Santa Fe Elementary School, Lowell Smith Jr. Middle School, and Cleburne High School.
Ownership History
Date
Name
Owned For
Owner Type
Purchase Details
Closed on
Aug 29, 2016
Sold by
Jole Matthew Dusti Joleann and Jole Matthew
Bought by
Almelda Groger and Dealmeida Enga
Current Estimated Value
Purchase Details
Closed on
Sep 29, 2014
Sold by
Hickman Amanda L and Tanton Amanda L
Bought by
Gurrola Martin and Garcia Angelica D
Home Financials for this Owner
Home Financials are based on the most recent Mortgage that was taken out on this home.
Original Mortgage
$87,289
Interest Rate
4.25%
Mortgage Type
FHA
Purchase Details
Closed on
Sep 30, 2009
Sold by
Ralph Littlejohn Homes & Construction In
Bought by
Hickman Amanda L
Home Financials for this Owner
Home Financials are based on the most recent Mortgage that was taken out on this home.
Original Mortgage
$83,361
Interest Rate
5.1%
Mortgage Type
FHA
Purchase Details
Closed on
Jul 31, 2007
Sold by
Rosenkrans Aaron
Bought by
Ralph Littlejohn Homes & Construction In
Create a Home Valuation Report for This Property
The Home Valuation Report is an in-depth analysis detailing your home's value as well as a comparison with similar homes in the area
Home Values in the Area
Average Home Value in this Area
Purchase History
| Date | Buyer | Sale Price | Title Company |
|---|---|---|---|
| Almelda Groger | -- | None Available | |
| Gurrola Martin | -- | Providence Title Company | |
| Hickman Amanda L | -- | None Available | |
| Ralph Littlejohn Homes & Construction In | -- | Fatco |
Source: Public Records
Mortgage History
| Date | Status | Borrower | Loan Amount |
|---|---|---|---|
| Previous Owner | Gurrola Martin | $87,289 | |
| Previous Owner | Hickman Amanda L | $83,361 |
Source: Public Records
Tax History Compared to Growth
Tax History
| Year | Tax Paid | Tax Assessment Tax Assessment Total Assessment is a certain percentage of the fair market value that is determined by local assessors to be the total taxable value of land and additions on the property. | Land | Improvement |
|---|---|---|---|---|
| 2025 | $1,666 | $133,911 | $23,500 | $110,411 |
| 2024 | $2,986 | $133,911 | $23,500 | $110,411 |
| 2023 | $1,510 | $133,911 | $23,500 | $110,411 |
| 2022 | $2,881 | $133,911 | $23,500 | $110,411 |
| 2021 | $2,731 | $133,911 | $23,500 | $110,411 |
| 2020 | $2,723 | $107,086 | $20,000 | $87,086 |
| 2019 | $2,640 | $110,465 | $20,000 | $90,465 |
| 2018 | $2,401 | $81,225 | $12,000 | $69,225 |
| 2017 | $2,391 | $81,225 | $12,000 | $69,225 |
| 2016 | $2,391 | $81,225 | $12,000 | $69,225 |
| 2015 | $2,165 | $81,225 | $12,000 | $69,225 |
| 2014 | $2,165 | $81,225 | $12,000 | $69,225 |
Source: Public Records
Map
Nearby Homes
- 107 Mcarthur Ln
- 735 N Robinson St
- 741 N Robinson St
- 709 N Wilhite St Unit 711
- 603 N Anglin St
- 614 N Robinson St
- 612 N Robinson St
- 105 E Lone Star Ave
- 922 N Buffalo Ave
- 312 N Wood St
- 109 Claude Ave
- 709 N Buffalo Ave
- 5348 State Highway 171 Unit 4
- 607 N Wood St
- 1204 N Wood St
- 702 N Walnut St
- 407 N Wilhite St
- 308 Poindexter Ave
- 1308 N Brazos Ave
- 507 N Buffalo Ave
- 735 N Anglin St
- 729 N Anglin St
- 737 N Anglin St
- 723 N Anglin St
- 112 Mcarthur Ln
- 738 N Anglin St
- 741 N Anglin St
- 730 N Main St
- 110 Mcarthur Ln
- 721 N Anglin St
- 732 N Main St
- 736 N Anglin St
- 732 N Anglin St
- 730 N Anglin St
- 740 N Anglin St
- 108 Mcarthur Ln
- 722 N Anglin St
- 742 N Anglin St
- 719 N Anglin St
- 720 N Anglin St