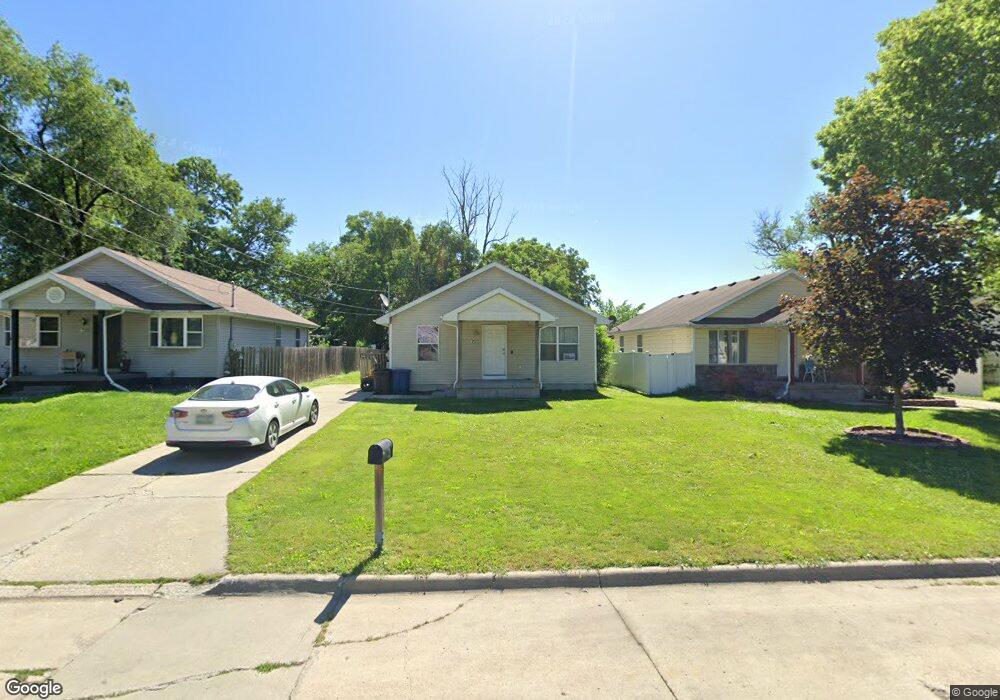
733 SE 27th Ct Des Moines, IA 50317
Chesterfield NeighborhoodEstimated Value: $190,000 - $234,000
3
Beds
1
Bath
1,070
Sq Ft
$193/Sq Ft
Est. Value
About This Home
This home is located at 733 SE 27th Ct, Des Moines, IA 50317 and is currently estimated at $206,634, approximately $193 per square foot. 733 SE 27th Ct is a home located in Polk County with nearby schools including Willard Elementary School, Hoyt Middle School, and East High School.
Ownership History
Date
Name
Owned For
Owner Type
Purchase Details
Closed on
Mar 22, 2011
Sold by
Bankers Trust Company
Bought by
Mcclish Michael T
Current Estimated Value
Home Financials for this Owner
Home Financials are based on the most recent Mortgage that was taken out on this home.
Original Mortgage
$110,000
Outstanding Balance
$76,640
Interest Rate
5.09%
Mortgage Type
Future Advance Clause Open End Mortgage
Estimated Equity
$129,994
Purchase Details
Closed on
Mar 30, 2006
Sold by
Diverse Solutions Group Llc
Bought by
Lewis Sara
Home Financials for this Owner
Home Financials are based on the most recent Mortgage that was taken out on this home.
Original Mortgage
$117,400
Interest Rate
6.33%
Mortgage Type
Fannie Mae Freddie Mac
Create a Home Valuation Report for This Property
The Home Valuation Report is an in-depth analysis detailing your home's value as well as a comparison with similar homes in the area
Home Values in the Area
Average Home Value in this Area
Purchase History
| Date | Buyer | Sale Price | Title Company |
|---|---|---|---|
| Mcclish Michael T | $63,500 | None Available | |
| Lewis Sara | $129,500 | None Available |
Source: Public Records
Mortgage History
| Date | Status | Borrower | Loan Amount |
|---|---|---|---|
| Open | Mcclish Michael T | $110,000 | |
| Previous Owner | Lewis Sara | $117,400 |
Source: Public Records
Tax History Compared to Growth
Tax History
| Year | Tax Paid | Tax Assessment Tax Assessment Total Assessment is a certain percentage of the fair market value that is determined by local assessors to be the total taxable value of land and additions on the property. | Land | Improvement |
|---|---|---|---|---|
| 2025 | $3,854 | $220,300 | $9,800 | $210,500 |
| 2024 | $3,854 | $195,900 | $8,500 | $187,400 |
| 2023 | $3,926 | $195,900 | $8,500 | $187,400 |
| 2022 | $3,896 | $166,600 | $7,400 | $159,200 |
| 2021 | $3,658 | $166,600 | $7,400 | $159,200 |
| 2020 | $3,800 | $146,600 | $6,500 | $140,100 |
| 2019 | $3,472 | $146,600 | $6,500 | $140,100 |
| 2018 | $218 | $129,200 | $5,600 | $123,600 |
| 2017 | $114 | $129,200 | $5,600 | $123,600 |
| 2016 | $112 | $125,000 | $5,300 | $119,700 |
| 2015 | $112 | $125,000 | $5,300 | $119,700 |
| 2014 | $106 | $124,200 | $5,200 | $119,000 |
Source: Public Records
Map
Nearby Homes