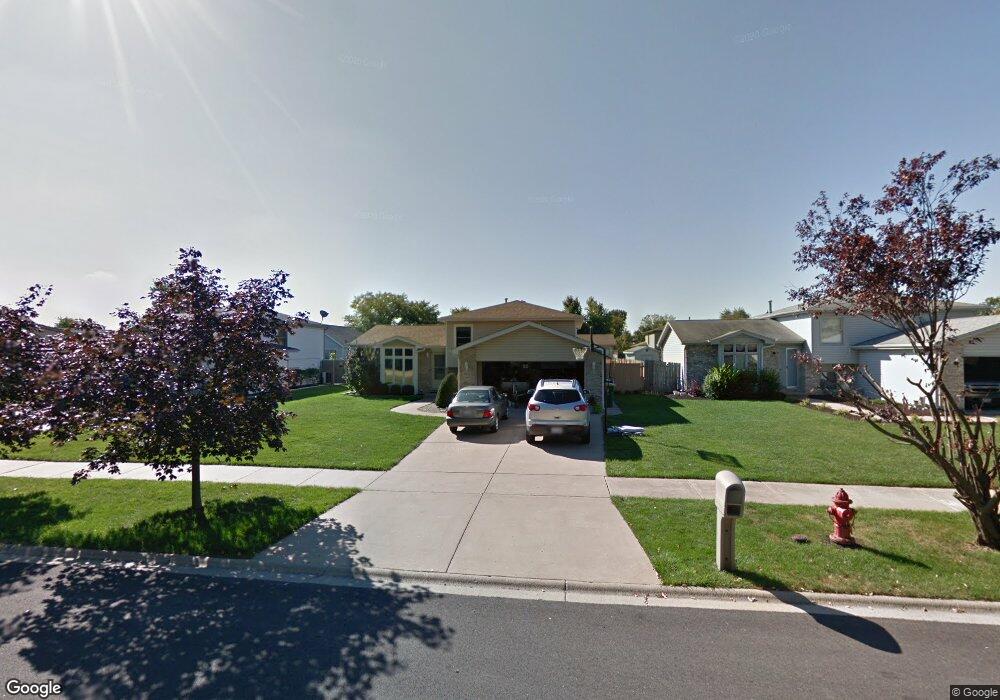
733 South St Lockport, IL 60441
South Lockport NeighborhoodEstimated Value: $305,903 - $371,000
--
Bed
--
Bath
--
Sq Ft
8,276
Sq Ft Lot
About This Home
This home is located at 733 South St, Lockport, IL 60441 and is currently estimated at $354,476. 733 South St is a home located in Will County with nearby schools including Taft Grade School, Lockport Township High School East, and Saint Dennis School.
Ownership History
Date
Name
Owned For
Owner Type
Purchase Details
Closed on
Mar 26, 2001
Sold by
Evans Christian J and Evans Debra L
Bought by
Misavage Gregory and Misavage Dolores J
Current Estimated Value
Home Financials for this Owner
Home Financials are based on the most recent Mortgage that was taken out on this home.
Original Mortgage
$128,400
Outstanding Balance
$47,333
Interest Rate
7.02%
Estimated Equity
$307,143
Purchase Details
Closed on
Jan 15, 2001
Sold by
Moss Chester R and Chester R Moss Trust
Bought by
Evans Christian J and Evans Debra L
Purchase Details
Closed on
Feb 27, 1995
Sold by
Morelli Randy S and Morelli Charlene M
Bought by
Moss Chester R
Home Financials for this Owner
Home Financials are based on the most recent Mortgage that was taken out on this home.
Original Mortgage
$90,000
Interest Rate
9.21%
Create a Home Valuation Report for This Property
The Home Valuation Report is an in-depth analysis detailing your home's value as well as a comparison with similar homes in the area
Home Values in the Area
Average Home Value in this Area
Purchase History
| Date | Buyer | Sale Price | Title Company |
|---|---|---|---|
| Misavage Gregory | $160,500 | -- | |
| Evans Christian J | -- | -- | |
| Moss Chester R | $130,000 | Chicago Title Insurance Co |
Source: Public Records
Mortgage History
| Date | Status | Borrower | Loan Amount |
|---|---|---|---|
| Open | Misavage Gregory | $128,400 | |
| Previous Owner | Moss Chester R | $90,000 |
Source: Public Records
Tax History Compared to Growth
Tax History
| Year | Tax Paid | Tax Assessment Tax Assessment Total Assessment is a certain percentage of the fair market value that is determined by local assessors to be the total taxable value of land and additions on the property. | Land | Improvement |
|---|---|---|---|---|
| 2024 | $7,192 | $97,525 | $27,426 | $70,099 |
| 2023 | $7,192 | $87,553 | $24,622 | $62,931 |
| 2022 | $6,659 | $82,477 | $23,194 | $59,283 |
| 2021 | $6,323 | $77,509 | $21,797 | $55,712 |
| 2020 | $6,171 | $74,960 | $21,080 | $53,880 |
| 2019 | $5,896 | $71,052 | $19,981 | $51,071 |
| 2018 | $5,655 | $66,998 | $18,841 | $48,157 |
| 2017 | $5,360 | $62,007 | $17,437 | $44,570 |
| 2016 | $5,508 | $62,154 | $17,479 | $44,675 |
| 2015 | $5,416 | $59,138 | $16,631 | $42,507 |
| 2014 | $5,416 | $57,416 | $16,147 | $41,269 |
| 2013 | $5,416 | $59,809 | $16,820 | $42,989 |
Source: Public Records
Map
Nearby Homes
- 1513 Connor Ave
- 1623 East St
- 1107 Garfield St
- 566 Mihelich Ln
- Key West Plan at Lago Vista
- Palm Harbour Plan at Lago Vista
- Coral Springs Plan at Lago Vista
- Boca Raton Plan at Lago Vista
- Key Largo Plan at Lago Vista
- Port Raton Plan at Lago Vista
- Coral Gables Plan at Lago Vista
- 1111 S Lincoln St
- 1410 Lawrence Ave
- 516 Whelan St
- 1004 Valley Ln
- 2005 Princess Ct
- 2009 Princess Ct
- 2021 Princess Ct
- 927 Putnam Dr
- 1413 Strawberry Hill Dr