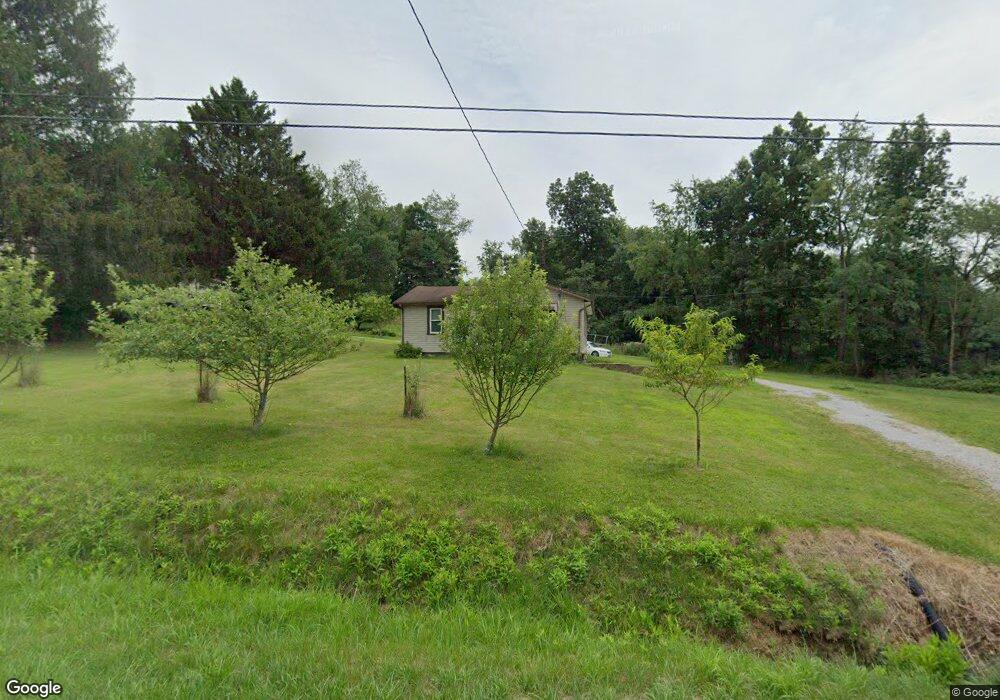
733 State Route 95 Loudonville, OH 44842
Estimated Value: $138,091 - $194,000
2
Beds
1
Bath
840
Sq Ft
$203/Sq Ft
Est. Value
About This Home
This home is located at 733 State Route 95, Loudonville, OH 44842 and is currently estimated at $170,273, approximately $202 per square foot. 733 State Route 95 is a home located in Ashland County with nearby schools including McMullen Elementary School, Budd Elementary School, and Loudonville High School.
Ownership History
Date
Name
Owned For
Owner Type
Purchase Details
Closed on
Feb 3, 2025
Sold by
Bartram Darlow C and Bartram Beverly J
Bought by
Bartram Nathan D and Bartram Rayleigha N
Current Estimated Value
Home Financials for this Owner
Home Financials are based on the most recent Mortgage that was taken out on this home.
Original Mortgage
$120,650
Outstanding Balance
$119,925
Interest Rate
6.85%
Mortgage Type
New Conventional
Estimated Equity
$50,348
Purchase Details
Closed on
Feb 28, 2024
Sold by
Jason M Prigozen Personalty Revocable Li
Bought by
Bartram Darlow C and Bartram Beverly J
Purchase Details
Closed on
Apr 22, 2022
Sold by
Prigozen Jason M
Bought by
Jason M Prigozen Personalty Revocable Living
Purchase Details
Closed on
Mar 17, 2017
Sold by
Drouhard Joseph T
Bought by
Pigozen Jason M
Create a Home Valuation Report for This Property
The Home Valuation Report is an in-depth analysis detailing your home's value as well as a comparison with similar homes in the area
Home Values in the Area
Average Home Value in this Area
Purchase History
| Date | Buyer | Sale Price | Title Company |
|---|---|---|---|
| Bartram Nathan D | $127,000 | Chicago Title | |
| Bartram Darlow C | $125,000 | Chicago Title | |
| Jason M Prigozen Personalty Revocable Living | -- | Gerber Aaron L | |
| Pigozen Jason M | $54,842 | Ashland Title Agcy |
Source: Public Records
Mortgage History
| Date | Status | Borrower | Loan Amount |
|---|---|---|---|
| Open | Bartram Nathan D | $120,650 |
Source: Public Records
Tax History Compared to Growth
Tax History
| Year | Tax Paid | Tax Assessment Tax Assessment Total Assessment is a certain percentage of the fair market value that is determined by local assessors to be the total taxable value of land and additions on the property. | Land | Improvement |
|---|---|---|---|---|
| 2024 | $1,552 | $39,170 | $10,770 | $28,400 |
| 2023 | $1,552 | $39,170 | $10,770 | $28,400 |
| 2022 | $1,232 | $27,020 | $7,430 | $19,590 |
| 2021 | $1,222 | $21,490 | $7,430 | $14,060 |
| 2020 | $917 | $21,490 | $7,430 | $14,060 |
| 2019 | $978 | $22,650 | $7,170 | $15,480 |
| 2018 | $955 | $21,960 | $7,170 | $14,790 |
| 2017 | $940 | $21,960 | $7,170 | $14,790 |
| 2016 | $797 | $19,110 | $6,240 | $12,870 |
| 2015 | $791 | $19,110 | $6,240 | $12,870 |
| 2013 | $773 | $18,370 | $5,910 | $12,460 |
Source: Public Records
Map
Nearby Homes
- 609 Ohio 95
- 560 Township Road 2402
- 968 Township Road 2506
- 0 Township Road 925
- 136 Bridge St
- 1406 Pearl Dr
- 0 County Road 917
- 2818 Township Road 2812
- 723 Pearl Dr
- 513 N Mount Vernon Ave
- 500 Stone Meadow Cir
- 524 N Union St
- 333 E Campbell St
- 316 E Campbell St
- 518 Snyder Dr
- 526 E Campbell St
- 78 Forest Hill Rd
- 0 Ashland County Road 2175
- 0 Ashland County Road 2175
- 733 Ohio 95
- 723 Ohio 95
- 732 State Route 95
- 721 State Route 95
- 742 State Route 95
- 2520 Township Road 687
- 2515 Township Road 827
- 697 State Route 95
- 700 State Route 95
- 700 Ohio 95
- 2503 Township Road 827
- 2529 Township Road 687
- 2527 687
- 792 State Route 95
- 2527 Township Road 687
- 788 State Route 95
- 691 Township Road 2475
- 869 Township Road 2475