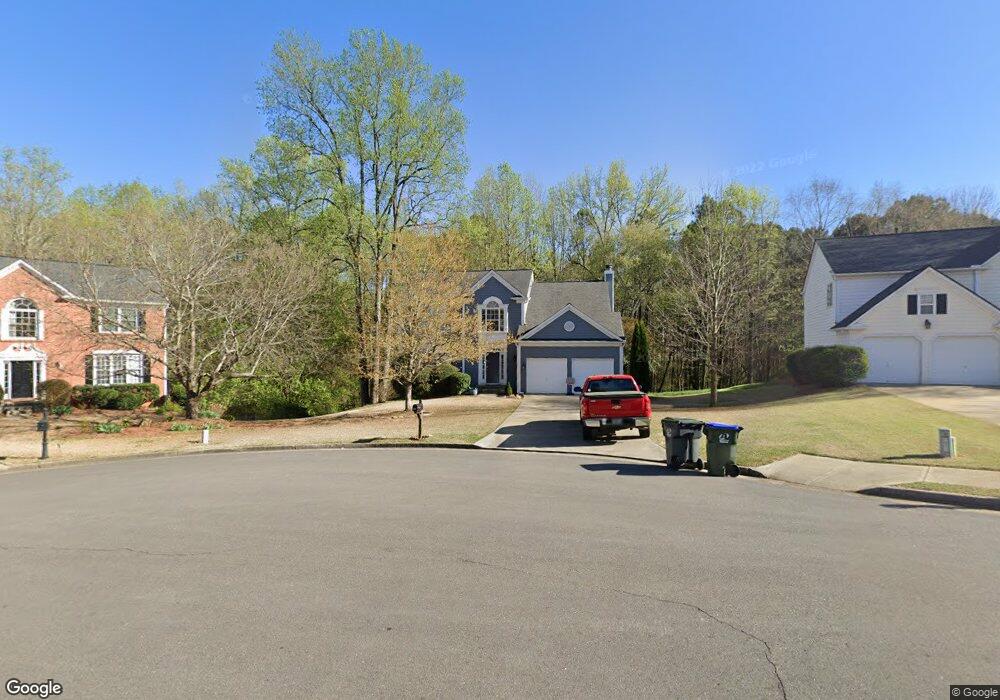
7330 Treyland Ct Cumming, GA 30041
Estimated Value: $608,000 - $662,856
4
Beds
3
Baths
2,196
Sq Ft
$287/Sq Ft
Est. Value
About This Home
This home is located at 7330 Treyland Ct, Cumming, GA 30041 and is currently estimated at $630,964, approximately $287 per square foot. 7330 Treyland Ct is a home located in Forsyth County with nearby schools including Brookwood Elementary School, South Forsyth Middle School, and Lambert High School.
Ownership History
Date
Name
Owned For
Owner Type
Purchase Details
Closed on
Dec 7, 2015
Sold by
Sumner Edward Charles
Bought by
Blackburn James Philip and Blackburn Dana Carter
Current Estimated Value
Home Financials for this Owner
Home Financials are based on the most recent Mortgage that was taken out on this home.
Original Mortgage
$270,750
Outstanding Balance
$217,228
Interest Rate
3.91%
Estimated Equity
$413,736
Purchase Details
Closed on
Jul 28, 2008
Sold by
Martinaitis Sandra A
Bought by
Sumner Edward C and Sumner Christine E
Home Financials for this Owner
Home Financials are based on the most recent Mortgage that was taken out on this home.
Original Mortgage
$217,800
Interest Rate
6.37%
Mortgage Type
New Conventional
Purchase Details
Closed on
Sep 30, 1997
Sold by
Pulte Home Corp
Bought by
Granata Dominic S
Create a Home Valuation Report for This Property
The Home Valuation Report is an in-depth analysis detailing your home's value as well as a comparison with similar homes in the area
Home Values in the Area
Average Home Value in this Area
Purchase History
| Date | Buyer | Sale Price | Title Company |
|---|---|---|---|
| Blackburn James Philip | $285,000 | -- | |
| Sumner Edward C | $272,500 | -- | |
| Granata Dominic S | $162,500 | -- |
Source: Public Records
Mortgage History
| Date | Status | Borrower | Loan Amount |
|---|---|---|---|
| Open | Blackburn James Philip | $270,750 | |
| Previous Owner | Sumner Edward C | $217,800 | |
| Closed | Granata Dominic S | -- |
Source: Public Records
Tax History Compared to Growth
Tax History
| Year | Tax Paid | Tax Assessment Tax Assessment Total Assessment is a certain percentage of the fair market value that is determined by local assessors to be the total taxable value of land and additions on the property. | Land | Improvement |
|---|---|---|---|---|
| 2025 | $5,351 | $260,008 | $78,000 | $182,008 |
| 2024 | $5,351 | $260,376 | $68,000 | $192,376 |
| 2023 | $4,368 | $223,460 | $60,000 | $163,460 |
| 2022 | $4,438 | $146,124 | $40,000 | $106,124 |
| 2021 | $3,839 | $146,124 | $40,000 | $106,124 |
| 2020 | $3,821 | $145,260 | $40,000 | $105,260 |
| 2019 | $3,810 | $144,476 | $40,000 | $104,476 |
| 2018 | $3,620 | $130,892 | $30,000 | $100,892 |
| 2017 | $3,164 | $113,992 | $30,000 | $83,992 |
| 2016 | $3,164 | $113,992 | $30,000 | $83,992 |
| 2015 | $2,709 | $97,432 | $30,000 | $67,432 |
| 2014 | $2,322 | $87,692 | $26,000 | $61,692 |
Source: Public Records
Map
Nearby Homes
- 7335 Lytham Trace
- 7045 Harlech Trace
- 7170 Collingsworth Place
- 7260 Fawn Lake Dr
- 7105 Brookwood Way
- 4020 Bridle Ridge Dr
- 3730 Lakeheath Dr
- 3585 Lakeheath Dr
- 3715 Lakeheath Dr
- 3820 Ridge Point Dr
- 110 W Meadows Ct
- 7530 Newstead Dr
- 3845 Bridle Creek Dr
- 11915 Carriage Park Ln
- 5105 Deerlake Dr
- 595 Barsham Way
- 3415 Fox Hollow Way
- 3150 Thistle Trail
- 5735 Sunset Maple Dr
- 7330 Treyland Ct
- 7320 Treyland Ct
- 0 Treyland Ct Unit 7352411
- 0 Treyland Ct Unit 8553471
- 7340 Treyland Ct
- 7315 Brassfield Dr
- 7315 Treyland Ct
- 7345 Treyland Ct Unit IV
- 7325 Brassfield Dr Unit IV
- 7310 Brassfield Dr
- 7335 Brassfield Dr
- 7265 Brassfield Dr Unit IV
- 7320 Brassfield Dr
- 7270 Brassfield Dr Unit IV
- 8035 Brookwood Way Unit IVB
- 7330 Brassfield Dr
- 8045 Brookwood Way
- 7345 Brassfield Dr
- 7255 Brassfield Dr Unit IV
- 7250 Brassfield Dr