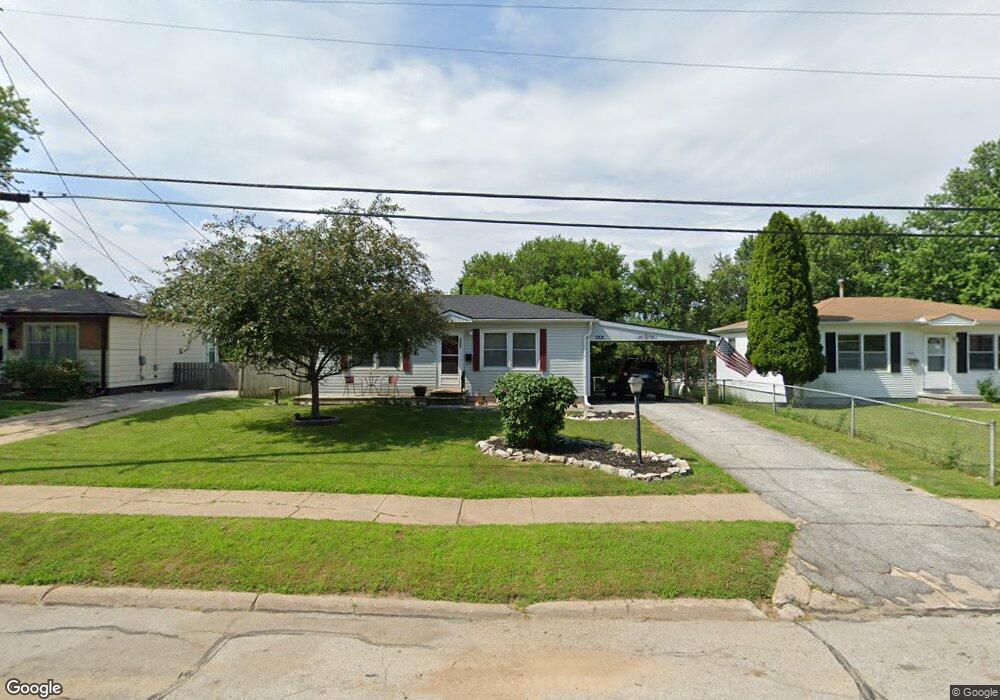
7331 James Ave La Vista, NE 68128
Estimated Value: $185,000 - $218,000
3
Beds
1
Bath
1,272
Sq Ft
$159/Sq Ft
Est. Value
About This Home
This home is located at 7331 James Ave, La Vista, NE 68128 and is currently estimated at $201,858, approximately $158 per square foot. 7331 James Ave is a home located in Sarpy County with nearby schools including G. Stanley Hall Elementary School, La Vista Middle School, and Papillion La Vista Senior High School.
Ownership History
Date
Name
Owned For
Owner Type
Purchase Details
Closed on
Jun 7, 2023
Sold by
Glover Julie K
Bought by
Alexander Jessica
Current Estimated Value
Purchase Details
Closed on
Oct 30, 2009
Sold by
Bohnenkamp Daniel B
Bought by
Ward Craig R
Home Financials for this Owner
Home Financials are based on the most recent Mortgage that was taken out on this home.
Original Mortgage
$98,138
Interest Rate
5.03%
Mortgage Type
FHA
Purchase Details
Closed on
May 10, 2006
Sold by
Stuart Patrick M and Stuart Denise J
Bought by
Bohnenkamp Daniel B
Home Financials for this Owner
Home Financials are based on the most recent Mortgage that was taken out on this home.
Original Mortgage
$73,600
Interest Rate
6.4%
Mortgage Type
Fannie Mae Freddie Mac
Purchase Details
Closed on
Mar 23, 2000
Sold by
Mid America Financial Investment Corp
Bought by
Stuart Patrick M and Stuart Denise J
Purchase Details
Closed on
Jan 3, 2000
Sold by
Brown Violet E
Bought by
Mid America Financial Investment Corp
Create a Home Valuation Report for This Property
The Home Valuation Report is an in-depth analysis detailing your home's value as well as a comparison with similar homes in the area
Home Values in the Area
Average Home Value in this Area
Purchase History
| Date | Buyer | Sale Price | Title Company |
|---|---|---|---|
| Alexander Jessica | $215,000 | Aksarben Title | |
| Ward Craig R | $100,000 | None Available | |
| Bohnenkamp Daniel B | $92,000 | Ots | |
| Stuart Patrick M | $73,000 | -- | |
| Mid America Financial Investment Corp | $42,501 | -- |
Source: Public Records
Mortgage History
| Date | Status | Borrower | Loan Amount |
|---|---|---|---|
| Previous Owner | Ward Craig R | $98,138 | |
| Previous Owner | Bohnenkamp Daniel B | $73,600 |
Source: Public Records
Tax History Compared to Growth
Tax History
| Year | Tax Paid | Tax Assessment Tax Assessment Total Assessment is a certain percentage of the fair market value that is determined by local assessors to be the total taxable value of land and additions on the property. | Land | Improvement |
|---|---|---|---|---|
| 2025 | $2,537 | $166,737 | $30,000 | $136,737 |
| 2024 | $2,883 | $152,877 | $28,000 | $124,877 |
| 2023 | $2,883 | $142,631 | $25,000 | $117,631 |
| 2022 | $2,739 | $127,597 | $22,000 | $105,597 |
| 2021 | $2,567 | $117,823 | $20,000 | $97,823 |
| 2020 | $2,483 | $112,813 | $20,000 | $92,813 |
| 2019 | $2,348 | $106,739 | $18,000 | $88,739 |
| 2018 | $2,183 | $97,796 | $18,000 | $79,796 |
| 2017 | $2,038 | $91,319 | $18,000 | $73,319 |
| 2016 | $1,911 | $85,766 | $18,000 | $67,766 |
| 2015 | $1,904 | $85,706 | $18,000 | $67,706 |
| 2014 | $1,892 | $84,611 | $18,000 | $66,611 |
| 2012 | -- | $83,769 | $18,000 | $65,769 |
Source: Public Records
Map
Nearby Homes
- 7322 Ira Ct
- 7324 Frederick Ave
- 7405 Josephine St
- 7518 Diane Ct
- 7201 James Ave
- 7511 Joseph Ave
- 7336 S 71st Ave
- 7544 Olive Ave
- 7432 La Vista Dr
- 7439 S 69th St
- 7606 Emiline St
- 7002 Edna St
- 7713 Cottonwood Ave
- 7813 Crabapple Ct
- 7712 Cottonwood Ave
- 6901 S 78th St
- 6722 S 75th St
- 7215 S 81st St
- 7837 S 70th St
- 6618 S 72nd Ave