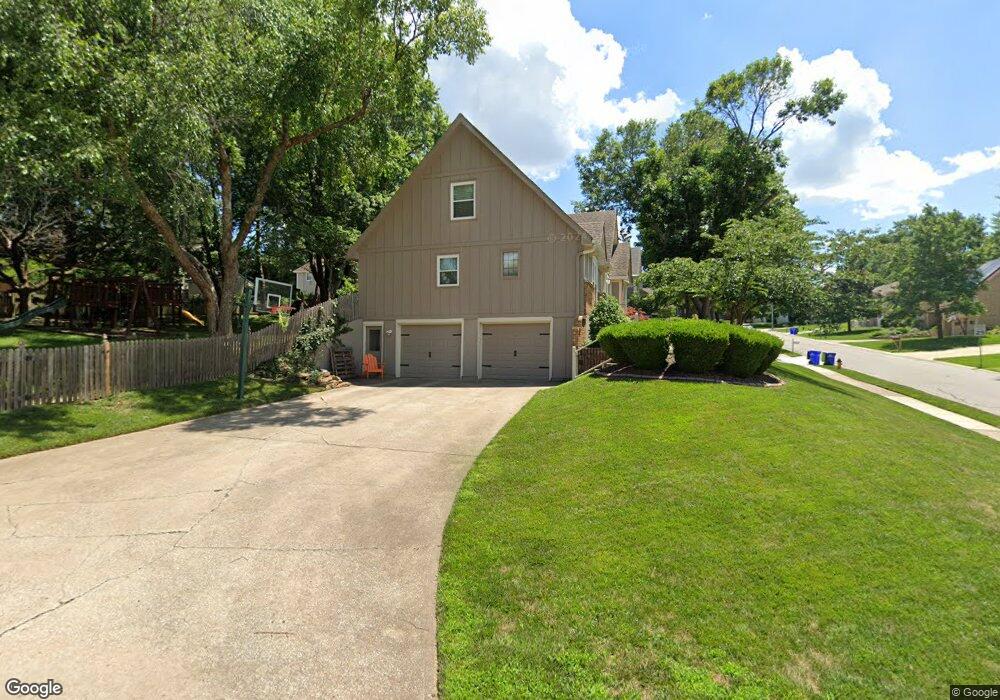
7331 Monrovia St Shawnee, KS 66216
Estimated Value: $418,103 - $448,000
4
Beds
3
Baths
2,249
Sq Ft
$193/Sq Ft
Est. Value
About This Home
This home is located at 7331 Monrovia St, Shawnee, KS 66216 and is currently estimated at $433,526, approximately $192 per square foot. 7331 Monrovia St is a home located in Johnson County with nearby schools including Mill Creek Elementary School, Trailridge Middle School, and Shawnee Mission Northwest High School.
Ownership History
Date
Name
Owned For
Owner Type
Purchase Details
Closed on
Nov 16, 2018
Sold by
Steging Joshua and Steging Ryann
Bought by
Steging Ryann K
Current Estimated Value
Home Financials for this Owner
Home Financials are based on the most recent Mortgage that was taken out on this home.
Original Mortgage
$216,000
Outstanding Balance
$188,425
Interest Rate
4.8%
Mortgage Type
New Conventional
Estimated Equity
$245,101
Purchase Details
Closed on
Nov 8, 2018
Sold by
Steging Ryann K
Bought by
Steging Ryann K and The Ryann K Steging Trust
Home Financials for this Owner
Home Financials are based on the most recent Mortgage that was taken out on this home.
Original Mortgage
$216,000
Outstanding Balance
$188,425
Interest Rate
4.8%
Mortgage Type
New Conventional
Estimated Equity
$245,101
Purchase Details
Closed on
Mar 11, 2010
Sold by
Medlock Thomas R and Medlock Julie Heaton
Bought by
Steging Joshua and Steging Ryann
Home Financials for this Owner
Home Financials are based on the most recent Mortgage that was taken out on this home.
Original Mortgage
$203,741
Interest Rate
5.25%
Mortgage Type
FHA
Create a Home Valuation Report for This Property
The Home Valuation Report is an in-depth analysis detailing your home's value as well as a comparison with similar homes in the area
Home Values in the Area
Average Home Value in this Area
Purchase History
| Date | Buyer | Sale Price | Title Company |
|---|---|---|---|
| Steging Ryann K | -- | Closing Usa Llc | |
| Steging Ryann K | -- | None Available | |
| Steging Joshua | -- | First American Title Ins Co |
Source: Public Records
Mortgage History
| Date | Status | Borrower | Loan Amount |
|---|---|---|---|
| Open | Steging Ryann K | $216,000 | |
| Closed | Steging Joshua | $203,741 |
Source: Public Records
Tax History
| Year | Tax Paid | Tax Assessment Tax Assessment Total Assessment is a certain percentage of the fair market value that is determined by local assessors to be the total taxable value of land and additions on the property. | Land | Improvement |
|---|---|---|---|---|
| 2025 | $4,266 | $42,193 | $8,871 | $33,322 |
| 2024 | $4,266 | $40,307 | $8,059 | $32,248 |
| 2023 | $4,483 | $41,791 | $8,059 | $33,732 |
| 2022 | $3,858 | $35,857 | $7,005 | $28,852 |
| 2021 | $3,934 | $34,328 | $6,369 | $27,959 |
| 2020 | $3,679 | $31,671 | $5,787 | $25,884 |
| 2019 | $3,614 | $31,096 | $5,266 | $25,830 |
| 2018 | $3,628 | $31,096 | $5,266 | $25,830 |
| 2017 | $3,427 | $28,911 | $4,577 | $24,334 |
| 2016 | $3,188 | $26,542 | $4,577 | $21,965 |
| 2015 | $2,922 | $25,243 | $4,577 | $20,666 |
| 2013 | -- | $23,357 | $4,577 | $18,780 |
Source: Public Records
Map
Nearby Homes
- 12122 W 73rd Terrace
- 7330 Charles St
- 12205 W 72nd St
- 5648 Long St
- 7611 Westgate St
- 7101 Parkhill St
- 7119 Gillette St
- 7212 Richards Dr
- 7238 Richards Dr
- 7232 Bond St
- 7107 Garnett St
- 11401 W 72nd Terrace
- 7802 Westgate Dr
- 11801 W 69th St
- 7829 Caenen St
- 12914 W 69th St
- 13105 W 69th St
- 12311 W 67th Terrace
- 12212 W 79th Terrace
- 12201 W 79th Terrace
- 7335 Monrovia St
- 7328 Charles Ct
- 7324 Charles Ct
- 7334 Charles Ct
- 12216 W 73rd Terrace
- 12212 W 73rd Terrace
- 7332 Monrovia St
- 7339 Monrovia St
- 7336 Monrovia St
- 7338 Charles Ct
- 12208 W 73rd Terrace
- 7340 Monrovia St
- 12204 W 73rd Terrace
- 7329 Long Ave
- 7344 Charles Ct
- 7333 Long Ave
- 7402 Monrovia St
- 7329 Charles Ct
- 7325 Charles Ct
Your Personal Tour Guide
Ask me questions while you tour the home.