


7332 Forrest Ave Pennsauken, NJ 08110
Colonial NeighborhoodHighlights
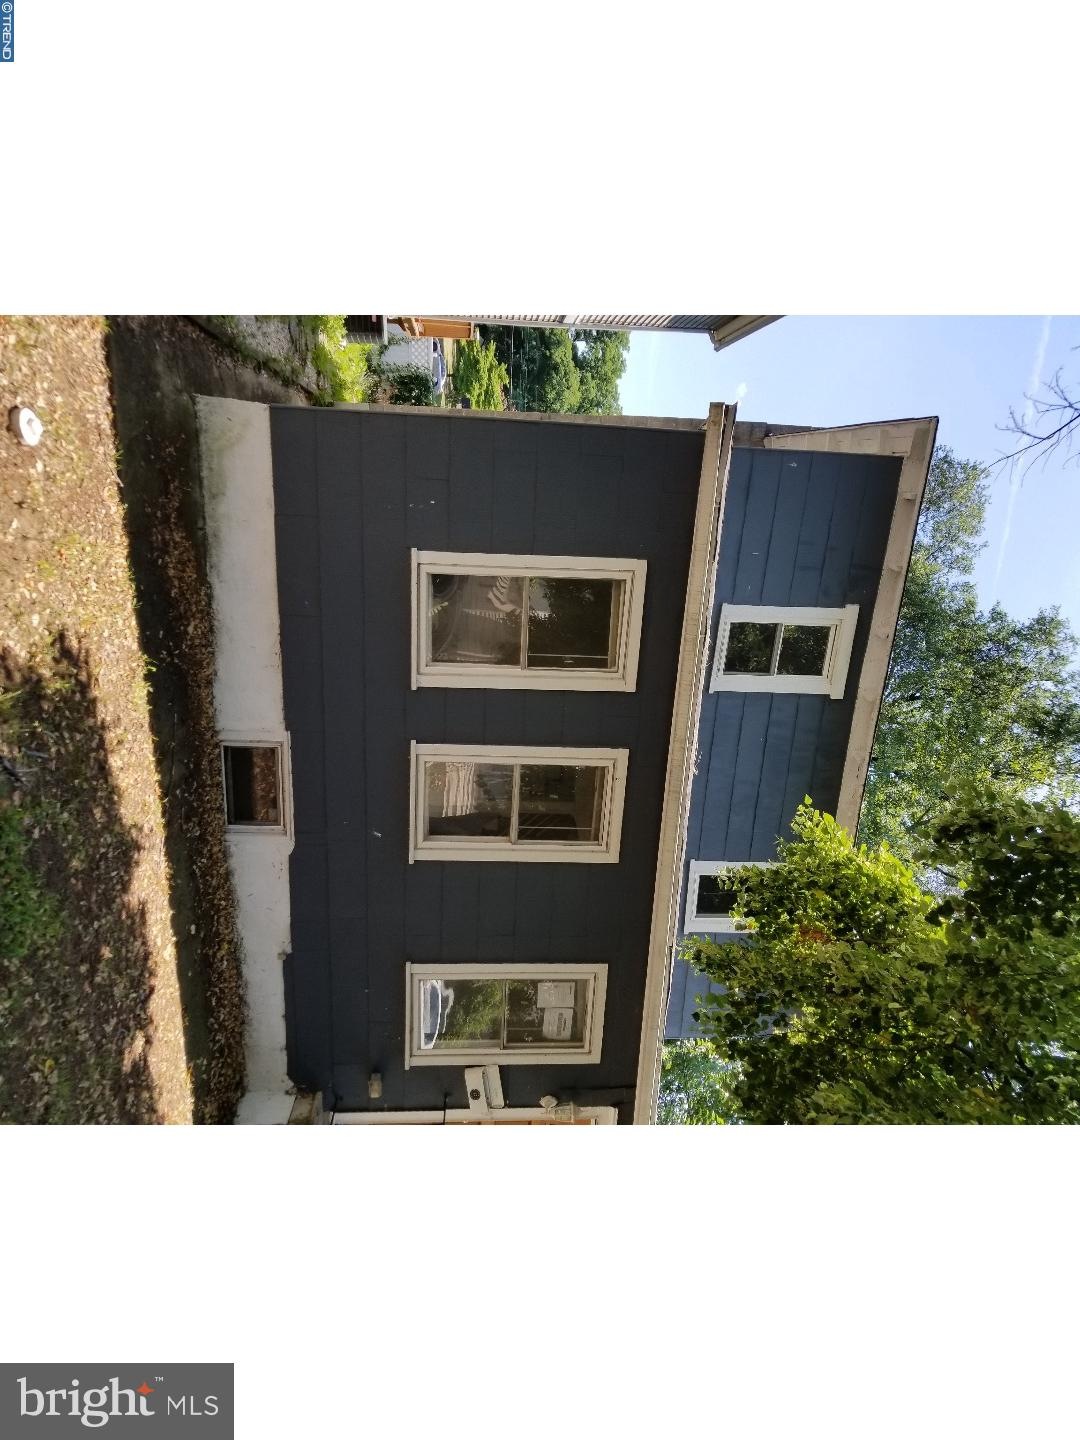
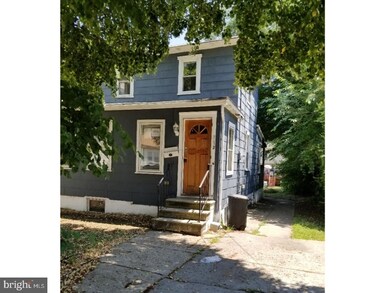
- Colonial Architecture
- Porch
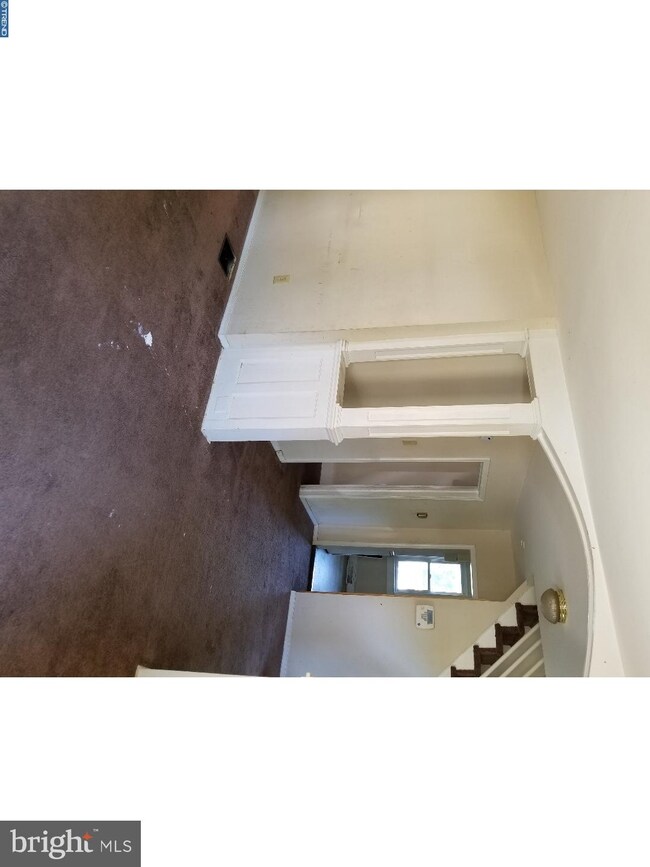
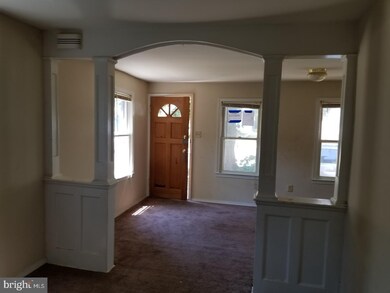
- Living Room
- No HOA
- Eat-In Kitchen
- En-Suite Primary Bedroom
About This Home
As of September 2022Love Grows best in Little Houses, so be a part of the Revolution! Classic colonial looking for new owners and has alot to offer other than price...Check out those "New Jersey reasonable taxes".....yes 4 words that typically do not go together Large Living room area with adjacent dining room for awesome entertaining and open floor plan. 1st floor features eat-in-kitchen as well as additional den that can be used as family room, home office, home gym or additional living space. This little BUNDlE of LOVE sits within walking distance to commuter rail line (Riverline) as well as quick access to Betsy Ross, Tacony-Palmyra Bridge as well as Route 130 and Route 73 for those North East Philly Commuters looking to be in striking distance of home. Restaurants and shopping are within 5-10 minute drive.

Home Details
Home Type
- Single Family
Est. Annual Taxes
- $2,803
Year Built
- Built in 1920
Lot Details
- 3,366 Sq Ft Lot
- Lot Dimensions are 34x99
- Property is in below average condition
Home Design
- Colonial Architecture
- Flat Roof Shape
- Pitched Roof
- Asbestos
Interior Spaces
- 860 Sq Ft Home
- Property has 2 Levels
- Living Room
- Dining Room
- Eat-In Kitchen
Flooring
- Wall to Wall Carpet
- Vinyl
Bedrooms and Bathrooms
- 2 Bedrooms
- En-Suite Primary Bedroom
- 1 Full Bathroom
Unfinished Basement
- Basement Fills Entire Space Under The House
- Exterior Basement Entry
- Laundry in Basement
Parking
- Driveway
- On-Street Parking
Outdoor Features
- Porch
Utilities
- Forced Air Heating System
- Heating System Uses Gas
- Natural Gas Water Heater
Community Details
- No Home Owners Association
Listing and Financial Details
- Tax Lot 00015
- Assessor Parcel Number 27-01412-00015
Ownership History
Purchase Details
Home Financials for this Owner
Home Financials are based on the most recent Mortgage that was taken out on this home.Purchase Details
Purchase Details
Home Financials for this Owner
Home Financials are based on the most recent Mortgage that was taken out on this home.Purchase Details
Purchase Details
Map
Home Values in the Area
Average Home Value in this Area
Purchase History
| Date | Type | Sale Price | Title Company |
|---|---|---|---|
| Bargain Sale Deed | $180,000 | Core Title | |
| Deed | -- | Sunnyside Title Agency | |
| Deed | $51,000 | None Available | |
| Sheriffs Deed | -- | None Available | |
| Bargain Sale Deed | $121,000 | -- |
Mortgage History
| Date | Status | Loan Amount | Loan Type |
|---|---|---|---|
| Open | $9,852 | FHA | |
| Open | $176,739 | FHA | |
| Previous Owner | $356,500 | Commercial | |
| Previous Owner | $22,500 | Unknown |
Property History
| Date | Event | Price | Change | Sq Ft Price |
|---|---|---|---|---|
| 09/23/2022 09/23/22 | Sold | $180,000 | +5.9% | $209 / Sq Ft |
| 08/15/2022 08/15/22 | For Sale | $169,900 | -5.6% | $198 / Sq Ft |
| 06/25/2022 06/25/22 | Off Market | $180,000 | -- | -- |
| 06/23/2022 06/23/22 | For Sale | $169,900 | 0.0% | $198 / Sq Ft |
| 10/20/2019 10/20/19 | Under Contract | -- | -- | -- |
| 10/18/2019 10/18/19 | Rented | $1,225 | 0.0% | -- |
| 10/10/2019 10/10/19 | Price Changed | $1,225 | -2.0% | $1 / Sq Ft |
| 09/30/2019 09/30/19 | For Rent | $1,250 | 0.0% | -- |
| 09/29/2019 09/29/19 | Off Market | $1,250 | -- | -- |
| 09/25/2019 09/25/19 | Price Changed | $1,250 | -2.0% | $1 / Sq Ft |
| 08/28/2019 08/28/19 | Price Changed | $1,275 | -1.9% | $1 / Sq Ft |
| 08/14/2019 08/14/19 | Price Changed | $1,300 | -1.9% | $2 / Sq Ft |
| 07/10/2019 07/10/19 | Price Changed | $1,325 | -1.5% | $2 / Sq Ft |
| 06/20/2019 06/20/19 | Price Changed | $1,345 | -0.4% | $2 / Sq Ft |
| 04/11/2019 04/11/19 | Price Changed | $1,350 | -3.6% | $2 / Sq Ft |
| 03/29/2019 03/29/19 | For Rent | $1,400 | 0.0% | -- |
| 08/31/2018 08/31/18 | Sold | $51,000 | -14.9% | $59 / Sq Ft |
| 08/15/2018 08/15/18 | Pending | -- | -- | -- |
| 07/11/2018 07/11/18 | For Sale | $59,900 | -- | $70 / Sq Ft |
Tax History
| Year | Tax Paid | Tax Assessment Tax Assessment Total Assessment is a certain percentage of the fair market value that is determined by local assessors to be the total taxable value of land and additions on the property. | Land | Improvement |
|---|---|---|---|---|
| 2024 | $3,308 | $102,700 | $22,800 | $79,900 |
| 2023 | $3,308 | $77,500 | $22,800 | $54,700 |
| 2022 | $2,991 | $77,500 | $22,800 | $54,700 |
| 2021 | $3,071 | $77,500 | $22,800 | $54,700 |
| 2020 | $2,751 | $77,500 | $22,800 | $54,700 |
| 2019 | $2,783 | $77,500 | $22,800 | $54,700 |
| 2018 | $2,798 | $77,500 | $22,800 | $54,700 |
| 2017 | $2,803 | $77,500 | $22,800 | $54,700 |
| 2016 | $2,753 | $77,500 | $22,800 | $54,700 |
| 2015 | $2,835 | $77,500 | $22,800 | $54,700 |
| 2014 | $2,775 | $49,900 | $11,300 | $38,600 |
Source: Bright MLS
MLS Number: 1002039276
APN: 27-01412-0000-00015
Disclaimer: Certain information contained herein is derived from information provided by parties other than Homes.com. All information provided is deemed reliable, but is not guaranteed to be accurate and should be independently verified.
![]() The data relating to real estate for sale on this website appears in part through the BRIGHT Internet Data Exchange program, a voluntary cooperative exchange of property listing data between licensed real estate brokerage firms, and is provided by BRIGHT through a licensing agreement.
The data relating to real estate for sale on this website appears in part through the BRIGHT Internet Data Exchange program, a voluntary cooperative exchange of property listing data between licensed real estate brokerage firms, and is provided by BRIGHT through a licensing agreement.
Listing information is from various brokers who participate in the Bright MLS IDX program and not all listings may be visible on the site.
The property information being provided on or through the website is for the personal, non-commercial use of consumers and such information may not be used for any purpose other than to identify prospective properties consumers may be interested in purchasing.
Some properties which appear for sale on the website may no longer be available because they are for instance, under contract, sold or are no longer being offered for sale.
Property information displayed is deemed reliable but is not guaranteed.
Copyright 2025 Bright MLS, Inc.
- 1530 Derousse Ave
- 503 Delair Ave
- 525 Derousse Ave
- 7924 River Rd
- 8136 River Rd
- 7929 Stow Rd
- 7531 Zimmerman Ave
- 234 Velde Ave
- 236 Curtis Ave
- 219 Engard Ave
- 7426 Wyndam Rd
- 8455 Balfour Rd
- 6235 Lincoln Ave
- 2248 Marlon Ave
- 7445 Grant Ave
- 479 Cove Rd
- 2517 Sherman Ave
- 7660 Wyndam Rd
- 1806 Horner Ave
- 2626 Manall Ave