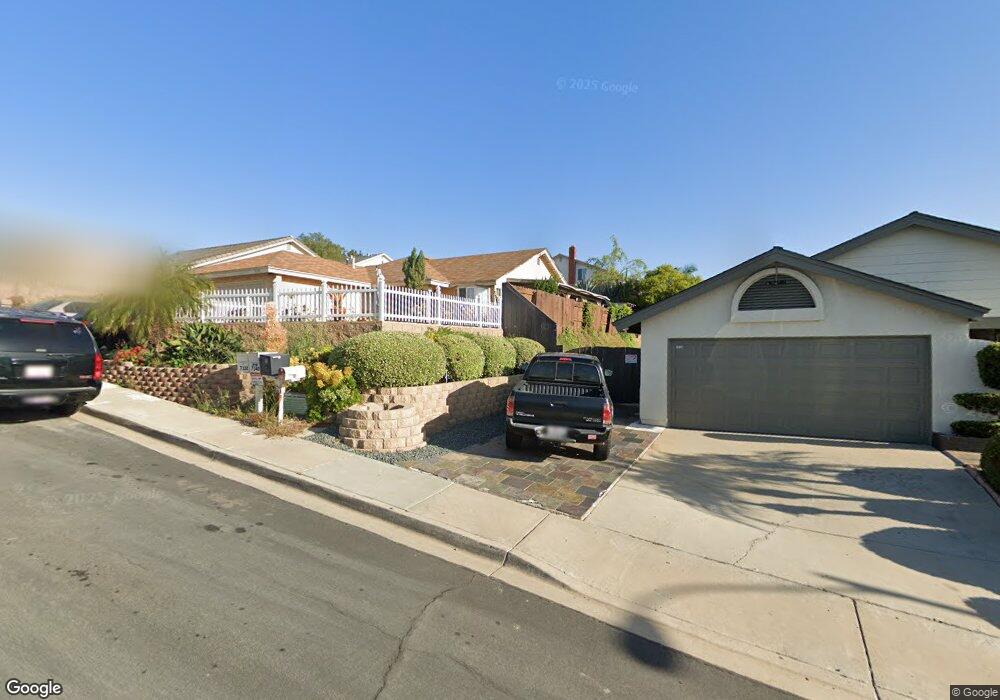
7332 Prancer Way San Diego, CA 92139
Bay Terraces NeighborhoodEstimated Value: $722,903 - $827,000
3
Beds
2
Baths
1,287
Sq Ft
$609/Sq Ft
Est. Value
About This Home
This home is located at 7332 Prancer Way, San Diego, CA 92139 and is currently estimated at $784,226, approximately $609 per square foot. 7332 Prancer Way is a home located in San Diego County with nearby schools including Zamorano Elementary School, Bell Middle School, and Morse High School.
Ownership History
Date
Name
Owned For
Owner Type
Purchase Details
Closed on
Oct 27, 2004
Sold by
Cacha Ronnie P and Cacha Celia
Bought by
Cacha Ronnie P and Cacha Celia
Current Estimated Value
Purchase Details
Closed on
May 24, 2004
Sold by
Cacha Celia B
Bought by
Cacha Ronnie P and Cacha Celia
Home Financials for this Owner
Home Financials are based on the most recent Mortgage that was taken out on this home.
Original Mortgage
$305,000
Outstanding Balance
$141,693
Interest Rate
5.37%
Mortgage Type
New Conventional
Estimated Equity
$642,533
Purchase Details
Closed on
Jun 26, 2003
Sold by
Cacha Ronnie P and Cacha Celia B
Bought by
Cacha Celia B
Home Financials for this Owner
Home Financials are based on the most recent Mortgage that was taken out on this home.
Original Mortgage
$265,000
Interest Rate
6.95%
Mortgage Type
Purchase Money Mortgage
Purchase Details
Closed on
Dec 4, 1990
Purchase Details
Closed on
Mar 25, 1986
Create a Home Valuation Report for This Property
The Home Valuation Report is an in-depth analysis detailing your home's value as well as a comparison with similar homes in the area
Home Values in the Area
Average Home Value in this Area
Purchase History
| Date | Buyer | Sale Price | Title Company |
|---|---|---|---|
| Cacha Ronnie P | -- | None Available | |
| Cacha Ronnie P | -- | Commerce Title Company | |
| Cacha Celia B | -- | Commonwealth Land Title Co | |
| -- | $155,000 | -- | |
| -- | $100,000 | -- |
Source: Public Records
Mortgage History
| Date | Status | Borrower | Loan Amount |
|---|---|---|---|
| Open | Cacha Ronnie P | $305,000 | |
| Closed | Cacha Celia B | $265,000 |
Source: Public Records
Tax History Compared to Growth
Tax History
| Year | Tax Paid | Tax Assessment Tax Assessment Total Assessment is a certain percentage of the fair market value that is determined by local assessors to be the total taxable value of land and additions on the property. | Land | Improvement |
|---|---|---|---|---|
| 2025 | $3,315 | $279,541 | $99,238 | $180,303 |
| 2024 | $3,315 | $274,061 | $97,293 | $176,768 |
| 2023 | $3,240 | $268,688 | $95,386 | $173,302 |
| 2022 | $3,152 | $263,420 | $93,516 | $169,904 |
| 2021 | $3,129 | $258,256 | $91,683 | $166,573 |
| 2020 | $3,090 | $255,608 | $90,743 | $164,865 |
| 2019 | $3,034 | $250,597 | $88,964 | $161,633 |
| 2018 | $2,836 | $245,684 | $87,220 | $158,464 |
| 2017 | $2,767 | $240,867 | $85,510 | $155,357 |
| 2016 | $2,720 | $236,145 | $83,834 | $152,311 |
| 2015 | $2,679 | $232,599 | $82,575 | $150,024 |
| 2014 | $2,636 | $228,044 | $80,958 | $147,086 |
Source: Public Records
Map
Nearby Homes
- 7549 Goode St
- 7040 Tenbury Ct
- 763 Kingswood St
- 7479 Tooma St Unit B
- 1153 Manzana Way
- 240 Ledgewood Ln
- 2620 Pennington Ln
- 2920 Briarwood Rd Unit B1
- 2920 Briarwood Rd
- 2920 Briarwood Rd Unit G11
- 2920 Briarwood Rd Unit C15
- 2920 Briarwood Rd Unit K13
- 1403 Manzana Way
- 7089 Wattle Dr
- 2876 Casey St Unit B
- 7449 Bullock Dr
- 1939 Manzana Way
- 6872 Quebec Ct Unit 5
- 6968 Appian Dr
- 177 Coralwood Dr
- 7340 Prancer Way
- 7349 Nebraska Ave
- 7357 Nebraska Ave
- 7316 Prancer Way
- 7348 Prancer Way
- 7341 Nebraska Ave
- 2204 Grove View Rd
- 7365 Nebraska Ave
- 2215 Spring Oak Way
- 7333 Nebraska Ave
- 7356 Prancer Way
- 7308 Prancer Way
- 2210 Grove View Rd
- 7373 Nebraska Ave
- 2223 Spring Oak Way
- 7325 Nebraska Ave
- 7355 Prancer Way
- 7364 Prancer Way
- 2208 Spring Oak Way
- 7352 Nebraska Ave