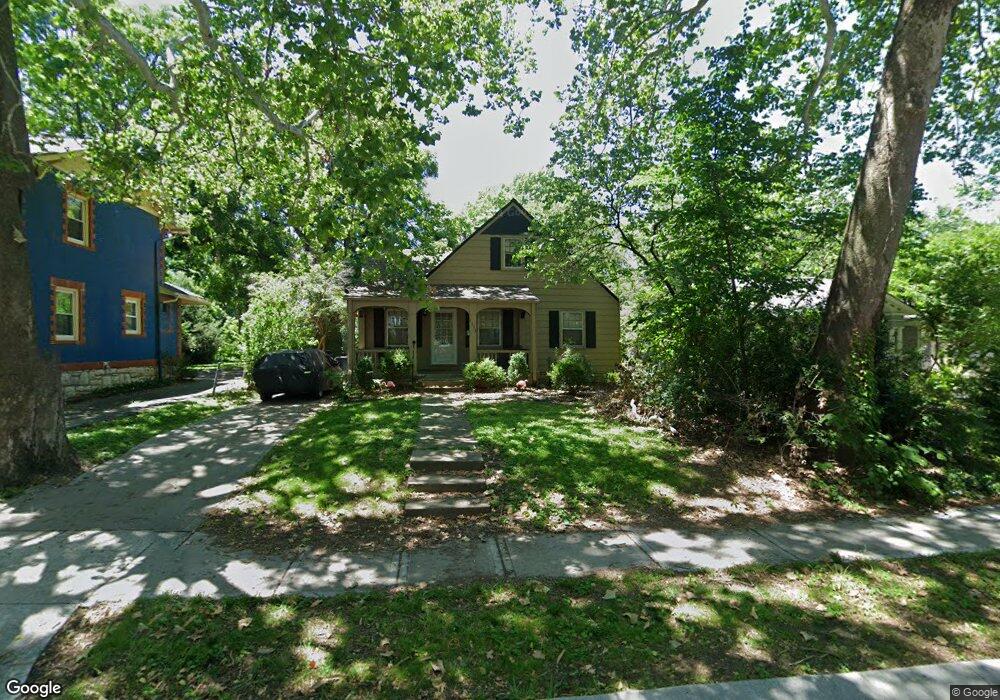
7334 Washington St Kansas City, MO 64114
Waldo NeighborhoodEstimated Value: $353,233 - $384,000
2
Beds
1
Bath
1,312
Sq Ft
$279/Sq Ft
Est. Value
About This Home
This home is located at 7334 Washington St, Kansas City, MO 64114 and is currently estimated at $366,308, approximately $279 per square foot. 7334 Washington St is a home located in Jackson County with nearby schools including Hale Cook Elementary, Central Middle School, and Southeast High School.
Ownership History
Date
Name
Owned For
Owner Type
Purchase Details
Closed on
Oct 25, 2016
Sold by
Mathews Reid A and Mathews Danielle R
Bought by
Mathews Reid A
Current Estimated Value
Home Financials for this Owner
Home Financials are based on the most recent Mortgage that was taken out on this home.
Original Mortgage
$163,461
Outstanding Balance
$131,211
Interest Rate
3.5%
Mortgage Type
FHA
Estimated Equity
$235,097
Purchase Details
Closed on
Jul 7, 2009
Sold by
Sneed David Bryan
Bought by
Mathews Reid A and Mangiameli Danielle R
Home Financials for this Owner
Home Financials are based on the most recent Mortgage that was taken out on this home.
Original Mortgage
$147,184
Interest Rate
4.97%
Mortgage Type
FHA
Purchase Details
Closed on
Jul 21, 1998
Sold by
Blakemore George and Blakemore Charlotte M
Bought by
Sneed David Bryan
Purchase Details
Closed on
Nov 28, 1995
Sold by
Barnett Leta Dora Blakemore
Bought by
Barnett Leta Dora Blakemore and Blakemore Nancy Sue
Create a Home Valuation Report for This Property
The Home Valuation Report is an in-depth analysis detailing your home's value as well as a comparison with similar homes in the area
Home Values in the Area
Average Home Value in this Area
Purchase History
| Date | Buyer | Sale Price | Title Company |
|---|---|---|---|
| Mathews Reid A | -- | Platinum Title Llc | |
| Mathews Reid A | -- | Kansas City Title | |
| Sneed David Bryan | -- | -- | |
| Barnett Leta Dora Blakemore | -- | -- |
Source: Public Records
Mortgage History
| Date | Status | Borrower | Loan Amount |
|---|---|---|---|
| Open | Mathews Reid A | $163,461 | |
| Closed | Mathews Reid A | $147,184 |
Source: Public Records
Tax History Compared to Growth
Tax History
| Year | Tax Paid | Tax Assessment Tax Assessment Total Assessment is a certain percentage of the fair market value that is determined by local assessors to be the total taxable value of land and additions on the property. | Land | Improvement |
|---|---|---|---|---|
| 2025 | $4,648 | $67,722 | $19,614 | $48,108 |
| 2024 | $4,604 | $58,889 | $19,920 | $38,969 |
| 2023 | $4,604 | $58,888 | $8,922 | $49,966 |
| 2022 | $4,470 | $54,340 | $31,257 | $23,083 |
| 2021 | $4,455 | $54,340 | $31,257 | $23,083 |
| 2020 | $3,962 | $47,729 | $31,257 | $16,472 |
| 2019 | $3,880 | $47,729 | $31,257 | $16,472 |
| 2018 | $1,929 | $24,233 | $3,096 | $21,137 |
| 2017 | $1,929 | $24,233 | $3,096 | $21,137 |
| 2016 | $1,907 | $23,819 | $3,535 | $20,284 |
| 2014 | $1,875 | $23,353 | $3,466 | $19,887 |
Source: Public Records
Map
Nearby Homes
- 7305 Washington St
- 7515 Jefferson St
- 7245 Wyandotte St
- 7220 Wyandotte St
- 707 W 75th Terrace
- 826 W 75th St
- 7135 Jefferson St
- 7217 Madison Ave
- 704 W 76th St
- 7602 Pennsylvania Ave
- 701 W Gregory Blvd
- 7235 Main St
- 16 E 73rd St
- 7135 Main St
- 720 W 77th St
- 7211 Walnut St
- 7027 Brookside Rd
- 7230 Grand Ave
- 7228 Grand Ave
- 7603 Main St
- 7328 Washington St
- 7338 Washington St
- 7326 Washington St
- 7322 Washington St
- 500 W 74th St
- 510 W 74th St
- 7318 Washington St
- 7329 Washington St
- 7323 Washington St
- 512 W 74th St
- 7333 Pennsylvania Ave
- 7329 Pennsylvania Ave
- 7337 Pennsylvania Ave
- 7325 Pennsylvania Ave
- 7308 Washington St
- 516 W 74th St
- 7311 Washington St
- 7319 Pennsylvania Ave
- 7309 Washington St
- 7306 Washington St