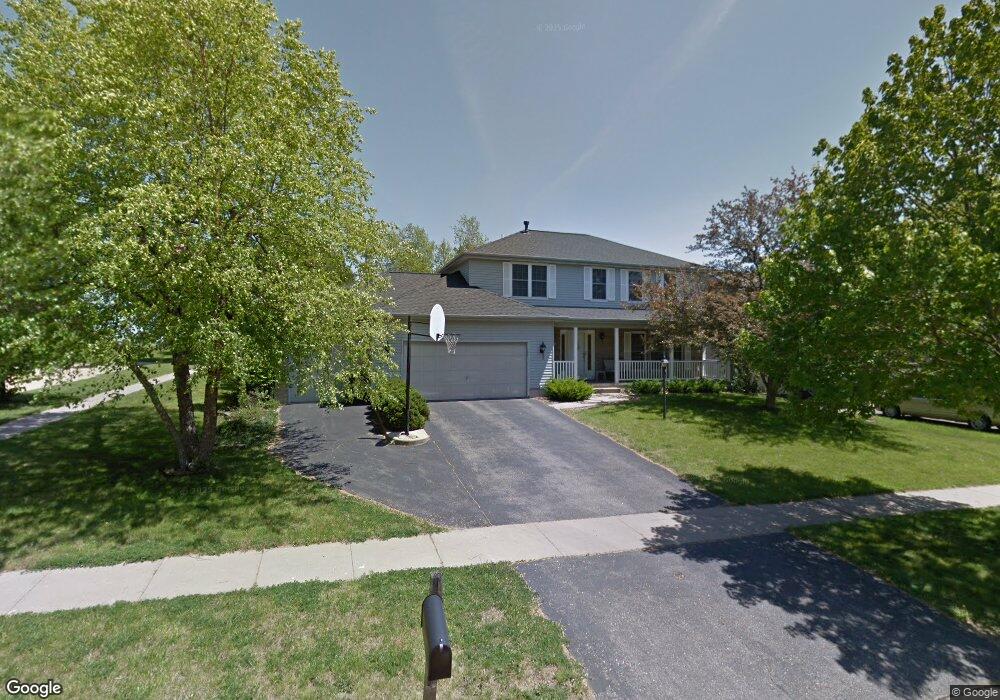
7336 Beckett Dr NE Cedar Rapids, IA 52402
Estimated Value: $333,000 - $382,460
5
Beds
4
Baths
2,391
Sq Ft
$149/Sq Ft
Est. Value
About This Home
This home is located at 7336 Beckett Dr NE, Cedar Rapids, IA 52402 and is currently estimated at $355,615, approximately $148 per square foot. 7336 Beckett Dr NE is a home located in Linn County with nearby schools including Bowman Woods Elementary School, Oak Ridge School, and Linn-Mar High School.
Ownership History
Date
Name
Owned For
Owner Type
Purchase Details
Closed on
Jun 26, 2012
Sold by
Kimball Cathia A and Kimball Michael A
Bought by
Kimball Michael A
Current Estimated Value
Purchase Details
Closed on
Jun 15, 2001
Sold by
Whiting Lloyd V and Whiting Dedee A
Bought by
Kimball Michael A and Kimball Cathia A
Home Financials for this Owner
Home Financials are based on the most recent Mortgage that was taken out on this home.
Original Mortgage
$100,000
Outstanding Balance
$38,148
Interest Rate
7.16%
Estimated Equity
$317,467
Purchase Details
Closed on
Aug 2, 1998
Sold by
Timko Frederick G and Timko Beverly A
Bought by
Whiting Lloyd V and Whiting Dedee A
Home Financials for this Owner
Home Financials are based on the most recent Mortgage that was taken out on this home.
Original Mortgage
$160,800
Interest Rate
7.05%
Create a Home Valuation Report for This Property
The Home Valuation Report is an in-depth analysis detailing your home's value as well as a comparison with similar homes in the area
Home Values in the Area
Average Home Value in this Area
Purchase History
| Date | Buyer | Sale Price | Title Company |
|---|---|---|---|
| Kimball Michael A | -- | None Available | |
| Kimball Michael A | $220,500 | -- | |
| Whiting Lloyd V | $200,500 | -- |
Source: Public Records
Mortgage History
| Date | Status | Borrower | Loan Amount |
|---|---|---|---|
| Open | Kimball Michael A | $100,000 | |
| Previous Owner | Whiting Lloyd V | $160,800 |
Source: Public Records
Tax History Compared to Growth
Tax History
| Year | Tax Paid | Tax Assessment Tax Assessment Total Assessment is a certain percentage of the fair market value that is determined by local assessors to be the total taxable value of land and additions on the property. | Land | Improvement |
|---|---|---|---|---|
| 2025 | $6,762 | $363,200 | $70,500 | $292,700 |
| 2024 | $6,524 | $355,600 | $70,500 | $285,100 |
| 2023 | $6,524 | $355,600 | $70,500 | $285,100 |
| 2022 | $5,990 | $294,300 | $64,100 | $230,200 |
| 2021 | $5,956 | $279,500 | $59,900 | $219,600 |
| 2020 | $5,956 | $262,300 | $49,200 | $213,100 |
| 2019 | $5,310 | $237,100 | $49,200 | $187,900 |
| 2018 | $5,080 | $237,100 | $49,200 | $187,900 |
| 2017 | $5,141 | $236,100 | $49,200 | $186,900 |
| 2016 | $5,141 | $229,800 | $49,200 | $180,600 |
| 2015 | $5,179 | $231,245 | $29,925 | $201,320 |
| 2014 | $4,984 | $231,245 | $29,925 | $201,320 |
| 2013 | $4,814 | $231,245 | $29,925 | $201,320 |
Source: Public Records
Map
Nearby Homes
- 342 Cambridge Dr NE
- 7320 Hampshire Dr NE
- 3310 Timber Ridge Ct
- 1000 Hampshire Cir
- 980 Hampshire Cir
- 960 Hampshire Cir
- 948 Hampshire Cir
- 1150 Bedford Ct
- 6726 Bowman Ln NE
- 916 Hampshire Cir
- 884 Hampshire Cir
- 316 Sussex Dr NE
- 932 Prescott Ln
- 862 Hampshire Cir
- 1151 Plumwood Ct NE
- 820 Hampshire Cir
- 819 Hampshire Cir
- 786 Hampshire Cir
- 7415 Pin Tail Dr NE
- 764 Hampshire Cir
- 7328 Beckett Dr NE
- 2998 Hawks Ridge Ln
- 7410 Beckett Dr NE
- 7320 Beckett Dr NE
- 2976 Hawks Ridge Ln
- 7335 Beckett Dr NE
- 7405 Beckett Dr NE
- 3018 Hawks Ridge Ln
- 7329 Beckett Dr NE
- 7424 Beckett Dr NE
- 2954 Hawks Ridge Ln
- 7415 Beckett Dr NE
- 7312 Beckett Dr NE
- 7321 Beckett Dr NE
- 2932 Hawks Ridge Ln
- 7425 Beckett Dr NE
- 3038 Hawks Ridge Ln
- 7304 Beckett Dr NE
- 7432 Beckett Dr NE
- 1482 Crescent Oak Ln