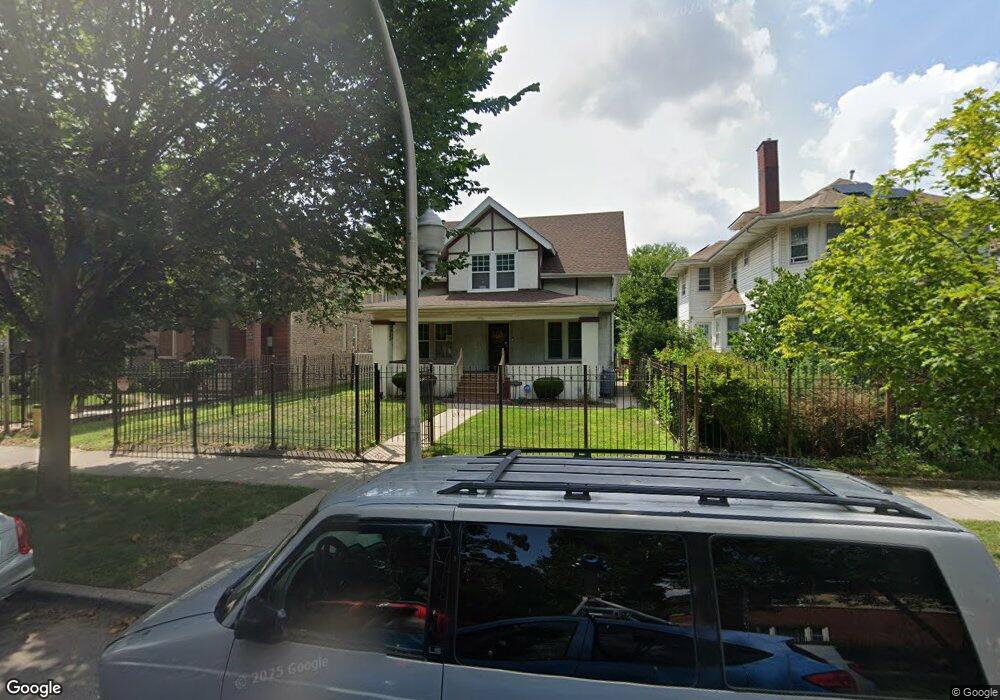
7336 S Phillips Ave Chicago, IL 60649
South Shore NeighborhoodEstimated Value: $184,000 - $334,000
3
Beds
2
Baths
1,775
Sq Ft
$146/Sq Ft
Est. Value
About This Home
This home is located at 7336 S Phillips Ave, Chicago, IL 60649 and is currently estimated at $259,728, approximately $146 per square foot. 7336 S Phillips Ave is a home located in Cook County with nearby schools including Powell Elementary Paideia Community Academy and St Philip Neri Elementary School.
Ownership History
Date
Name
Owned For
Owner Type
Purchase Details
Closed on
May 24, 2002
Sold by
Davis Kimberly
Bought by
Davis Kimberly and Davis Leslie M
Current Estimated Value
Purchase Details
Closed on
Feb 27, 1998
Sold by
Gillard Arnold R
Bought by
Davis Kimberly
Home Financials for this Owner
Home Financials are based on the most recent Mortgage that was taken out on this home.
Original Mortgage
$93,000
Outstanding Balance
$14,994
Interest Rate
7.08%
Mortgage Type
FHA
Estimated Equity
$244,734
Purchase Details
Closed on
Dec 27, 1996
Sold by
Cook County Development Corp
Bought by
Gillard Arnold R
Purchase Details
Closed on
Dec 20, 1996
Sold by
Bankers Trust Company Of California
Bought by
Cook County Development Corp
Purchase Details
Closed on
Sep 27, 1995
Sold by
Va
Bought by
Bankers Trust Company Of California Na
Create a Home Valuation Report for This Property
The Home Valuation Report is an in-depth analysis detailing your home's value as well as a comparison with similar homes in the area
Home Values in the Area
Average Home Value in this Area
Purchase History
We collect this data history from publicly available records. To have your information removed, we recommend requesting removal directly through your county’s website.
| Date | Buyer | Sale Price | Title Company |
|---|---|---|---|
| Davis Kimberly | -- | -- | |
| Davis Kimberly | $95,000 | -- | |
| Gillard Arnold R | -- | -- | |
| Cook County Development Corp | -- | -- | |
| Bankers Trust Company Of California Na | -- | -- |
Source: Public Records
Mortgage History
We collect this data history from publicly available records. To have your information removed, we recommend requesting removal directly through your county’s website.
| Date | Status | Borrower | Loan Amount |
|---|---|---|---|
| Open | Davis Kimberly | $93,000 |
Source: Public Records
Tax History
| Year | Tax Paid | Tax Assessment Tax Assessment Total Assessment is a certain percentage of the fair market value that is determined by local assessors to be the total taxable value of land and additions on the property. | Land | Improvement |
|---|---|---|---|---|
| 2025 | $2,757 | $22,000 | $10,996 | $11,004 |
| 2024 | $2,757 | $22,000 | $10,996 | $11,004 |
| 2023 | $2,652 | $17,001 | $11,688 | $5,313 |
| 2022 | $2,652 | $17,001 | $11,688 | $5,313 |
| 2021 | $2,615 | $16,999 | $11,687 | $5,312 |
| 2020 | $3,095 | $17,618 | $8,415 | $9,203 |
| 2019 | $3,106 | $19,576 | $8,415 | $11,161 |
| 2018 | $3,053 | $19,576 | $8,415 | $11,161 |
| 2017 | $3,184 | $18,840 | $7,480 | $11,360 |
| 2016 | $3,130 | $18,840 | $7,480 | $11,360 |
| 2015 | $3,194 | $20,805 | $7,480 | $13,325 |
| 2014 | $2,440 | $15,719 | $6,545 | $9,174 |
| 2013 | $2,381 | $15,719 | $6,545 | $9,174 |
Source: Public Records
Map
Nearby Homes
- 2448 E 74th St
- 7400 S Phillips Ave
- 7412 S Phillips Ave
- 2430 E 73rd St
- 2459 E 74th St
- 7327 S Kingston Ave Unit 2
- 2469 E 74th St
- 7219 S Yates Blvd Unit 72193A
- 7220 S Yates Blvd
- 7209 S Yates Blvd Unit 72092B
- 7340 S Crandon Ave
- 2339 E 72nd St Unit 1
- 7343 S Luella Ave
- 7223 S Coles Ave
- 7332 S Luella Ave
- 7316 S South Shore Dr
- 2651 E 74th St Unit 201
- 7251 S Paxton Ave
- 7600 S Phillips Ave
- 7601 S Essex Ave Unit 2
- 7342 S Phillips Ave
- 7332 S Phillips Ave
- 7344 S Phillips Ave
- 7346 S Phillips Ave Unit 1
- 7346 S Phillips Ave Unit 2
- 7346 S Phillips Ave Unit 3
- 7346 S Phillips Ave
- 7324 S Phillips Ave
- 7320 S Phillips Ave
- 7350 S Phillips Ave Unit 612
- 7350 S Phillips Ave
- 7350 S Phillips Ave
- 7350 S Phillips Ave Unit 210
- 7350 S Phillips Ave Unit 101
- 7350 S Phillips Ave Unit 406
- 7350 S Phillips Ave Unit 306
- 7350 S Phillips Ave Unit 303
- 7350 S Phillips Ave Unit 304
- 7350 S Phillips Ave Unit 105
- 7350 S Phillips Ave Unit 103
Your Personal Tour Guide
Ask me questions while you tour the home.