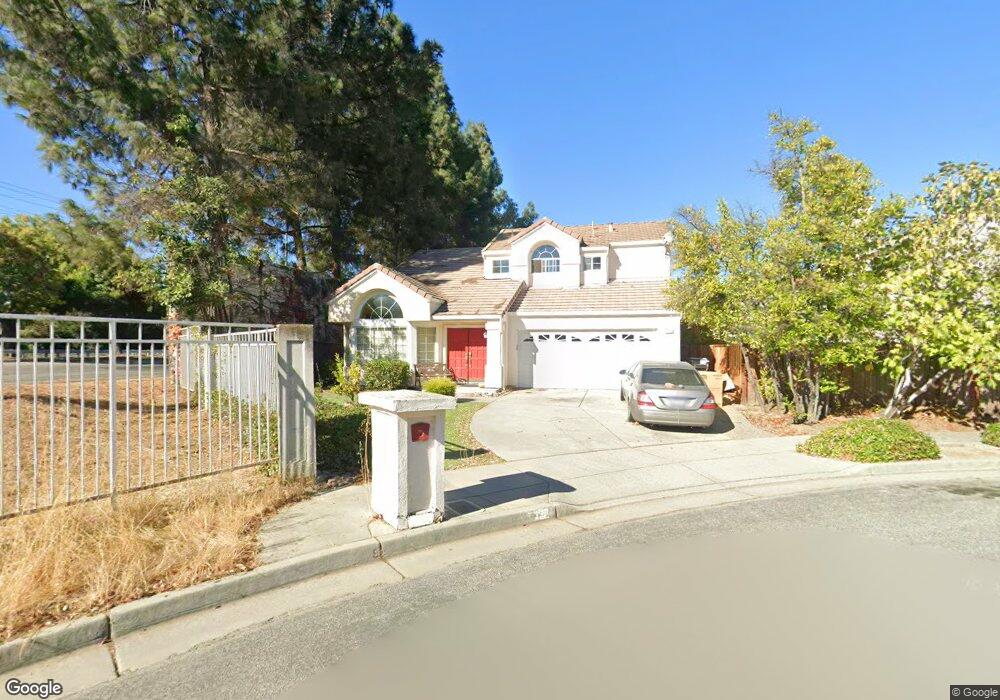
7337 Prindiville Dr San Jose, CA 95138
Los Paseos NeighborhoodEstimated Value: $1,444,000 - $1,672,000
4
Beds
3
Baths
1,827
Sq Ft
$841/Sq Ft
Est. Value
About This Home
This home is located at 7337 Prindiville Dr, San Jose, CA 95138 and is currently estimated at $1,537,376, approximately $841 per square foot. 7337 Prindiville Dr is a home located in Santa Clara County with nearby schools including Los Paseos Elementary School, Martin Murphy Middle School, and Ann Sobrato High School.
Ownership History
Date
Name
Owned For
Owner Type
Purchase Details
Closed on
Aug 29, 2016
Sold by
Ngo Truong D
Bought by
Do Krystine M
Current Estimated Value
Purchase Details
Closed on
Dec 22, 2000
Sold by
Bal Kejbir Singh and Nijjer Satinderbir K
Bought by
Ngo Truong D
Home Financials for this Owner
Home Financials are based on the most recent Mortgage that was taken out on this home.
Original Mortgage
$479,500
Interest Rate
7.08%
Mortgage Type
Stand Alone First
Purchase Details
Closed on
Dec 9, 1997
Sold by
Rodriguez Richard L and Rodriguez Pat S
Bought by
Bal Kejbir Singh and Nijjer Satinderbir K
Home Financials for this Owner
Home Financials are based on the most recent Mortgage that was taken out on this home.
Original Mortgage
$237,000
Interest Rate
7.23%
Create a Home Valuation Report for This Property
The Home Valuation Report is an in-depth analysis detailing your home's value as well as a comparison with similar homes in the area
Home Values in the Area
Average Home Value in this Area
Purchase History
| Date | Buyer | Sale Price | Title Company |
|---|---|---|---|
| Do Krystine M | -- | None Available | |
| Ngo Truong D | $560,000 | Commonwealth Land Title Co | |
| Bal Kejbir Singh | $316,000 | Commonwealth Land Title Co |
Source: Public Records
Mortgage History
| Date | Status | Borrower | Loan Amount |
|---|---|---|---|
| Previous Owner | Ngo Truong D | $479,500 | |
| Previous Owner | Bal Kejbir Singh | $237,000 | |
| Closed | Ngo Truong D | $109,600 |
Source: Public Records
Tax History Compared to Growth
Tax History
| Year | Tax Paid | Tax Assessment Tax Assessment Total Assessment is a certain percentage of the fair market value that is determined by local assessors to be the total taxable value of land and additions on the property. | Land | Improvement |
|---|---|---|---|---|
| 2025 | $11,973 | $854,022 | $357,335 | $496,687 |
| 2024 | $11,973 | $837,278 | $350,329 | $486,949 |
| 2023 | $11,762 | $820,861 | $343,460 | $477,401 |
| 2022 | $11,584 | $804,767 | $336,726 | $468,041 |
| 2021 | $11,251 | $788,988 | $330,124 | $458,864 |
| 2020 | $10,906 | $780,898 | $326,739 | $454,159 |
| 2019 | $11,117 | $765,587 | $320,333 | $445,254 |
| 2018 | $11,047 | $750,576 | $314,052 | $436,524 |
| 2017 | $10,928 | $726,741 | $155,796 | $570,945 |
| 2016 | $10,286 | $712,492 | $152,742 | $559,750 |
| 2015 | $9,410 | $638,000 | $136,800 | $501,200 |
| 2014 | $9,018 | $616,000 | $132,100 | $483,900 |
Source: Public Records
Map
Nearby Homes
- 6986 Gregorich Dr Unit C
- 45 Cheltenham Way
- 6958 Gregorich Dr Unit G
- 6945 Rodling Dr Unit C
- 7392 Tulare Hill Dr
- 7237 Longhill Way
- 6901 Rodling Dr Unit D
- 6130 Monterey Rd Unit 201
- 6130 Monterey Rd Unit 289
- 6130 Monterey Rd Unit 9
- 6130 Monterey Rd Unit 159
- 6130 Monterey Rd Unit 316
- 7260 Clear Vista Ct
- 1083 Esparanza Way
- 1075 Esparanza Way
- 7270 Alder Spring Way
- 1021 Chagall Way
- 202 French Ct
- 828 Monarch Ln
- 7189 Rosencrans Way
- 7335 Prindiville Dr
- 7333 Prindiville Dr
- 7329 Urshan Way
- 7331 Prindiville Dr
- 7364 Prindiville Dr
- 7356 Prindiville Dr
- 7358 Prindiville Dr
- 7354 Prindiville Dr
- 7360 Prindiville Dr
- 7352 Prindiville Dr
- 113 Prindiville Ct
- 7316 Urshan Way
- 115 Prindiville Ct
- 7318 Urshan Way
- 7351 Forsum Rd
- 7349 Forsum Rd
- 7353 Forsum Rd
- 117 Prindiville Ct
- 20 Avenida Espana
- 7320 Urshan Way