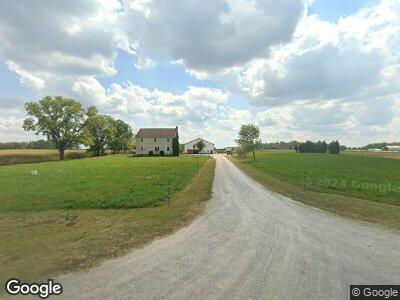
7337 W Randolph County Line Williamsburg, IN 47393
Estimated Value: $216,000 - $282,000
5
Beds
2
Baths
2,752
Sq Ft
$93/Sq Ft
Est. Value
About This Home
This home is located at 7337 W Randolph County Line, Williamsburg, IN 47393 and is currently estimated at $255,122, approximately $92 per square foot. 7337 W Randolph County Line is a home located in Wayne County with nearby schools including Northeastern Elementary School, Northeastern Middle School, and Northeastern High School.
Ownership History
Date
Name
Owned For
Owner Type
Purchase Details
Closed on
May 11, 2023
Sold by
Blank John L and Blank Rebecca E
Bought by
Stoltzfus Henry F and Stoltzfus Anna K
Current Estimated Value
Home Financials for this Owner
Home Financials are based on the most recent Mortgage that was taken out on this home.
Original Mortgage
$64,000
Outstanding Balance
$55,101
Interest Rate
6.39%
Mortgage Type
Credit Line Revolving
Estimated Equity
$195,377
Purchase Details
Closed on
Feb 18, 2016
Sold by
Blank Amos G and Blank Rebecca R
Bought by
Blank John L and Blank Rebecca E
Home Financials for this Owner
Home Financials are based on the most recent Mortgage that was taken out on this home.
Original Mortgage
$77,400
Interest Rate
3.81%
Mortgage Type
New Conventional
Purchase Details
Closed on
Aug 24, 2009
Sold by
Stoltzufs Jonas S and Stoltzufs Barbara F
Bought by
Blank Amos G and Blank Rebecca R
Create a Home Valuation Report for This Property
The Home Valuation Report is an in-depth analysis detailing your home's value as well as a comparison with similar homes in the area
Home Values in the Area
Average Home Value in this Area
Purchase History
| Date | Buyer | Sale Price | Title Company |
|---|---|---|---|
| Stoltzfus Henry F | $200,000 | None Listed On Document | |
| Blank John L | $120,000 | None Available | |
| Blank Amos G | -- | -- |
Source: Public Records
Mortgage History
| Date | Status | Borrower | Loan Amount |
|---|---|---|---|
| Open | Stoltzfus Henry F | $64,000 | |
| Open | Stoltzfus Henry F | $160,000 | |
| Previous Owner | Blank John L | $77,400 |
Source: Public Records
Tax History Compared to Growth
Tax History
| Year | Tax Paid | Tax Assessment Tax Assessment Total Assessment is a certain percentage of the fair market value that is determined by local assessors to be the total taxable value of land and additions on the property. | Land | Improvement |
|---|---|---|---|---|
| 2024 | $2,414 | $199,900 | $22,900 | $177,000 |
| 2023 | $2,414 | $196,600 | $20,300 | $176,300 |
| 2022 | $4,190 | $203,700 | $18,700 | $185,000 |
| 2021 | $3,860 | $186,100 | $18,000 | $168,100 |
| 2020 | $3,816 | $182,500 | $17,800 | $164,700 |
| 2019 | $2,272 | $185,500 | $18,700 | $166,800 |
| 2018 | $2,181 | $185,500 | $18,900 | $166,600 |
| 2017 | $2,143 | $187,100 | $19,700 | $167,400 |
| 2016 | $1,921 | $176,900 | $20,100 | $156,800 |
| 2014 | $1,649 | $168,400 | $20,400 | $148,000 |
| 2013 | $1,649 | $165,100 | $19,400 | $145,700 |
Source: Public Records
Map
Nearby Homes
- 00 Centerville Rd
- 0 Walnut St
- 0 Sycamore St
- 274 4th St
- 9044 N Round Barn Rd
- 1365 E 825 S
- 705 Westwood Dr
- 312 S Main St
- 4949 W New Garden Rd
- 323 N Main St
- 6855 N Centerville Rd
- 7062 N Ora Pitts Rd
- 1820 E 700 S
- 0 Davis
- 701 W Cherry St
- 603 Fountain Ave
- 303 Hartley Ave
- 0 Hill Rd
- 315 U S 27
- 5552 N Mineral Springs Rd
- 7337 W Randolph County Line
- 1890 W 1100 S
- 1838 W 1100 S
- 7655 W Randolph County Line
- 7583 W Randolph County Line
- 6995 W Randolph County Line
- 1766 W 1100 S
- 10693 S 200 W
- 2540 W 1100 S
- 7967 W Randolph County Line
- 7034 Morgan Creek Rd
- 10393 S 200 W
- 6629 W Randolph County Line
- 7568 Morgan Creek Rd
- 7192 Morgan Creek Rd
- 11817 N Carlos Rd
- 7413 Morgan Creek Rd
- 7109 Morgan Creek Rd