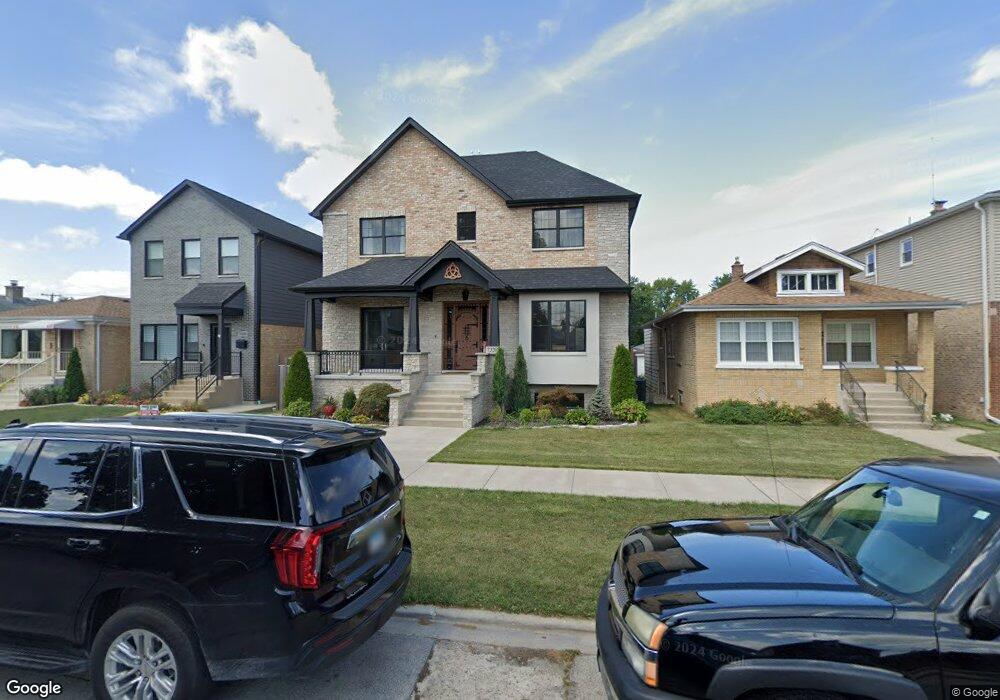
7338 W Clarence Ave Chicago, IL 60631
Norwood Park NeighborhoodEstimated Value: $853,000 - $1,106,029
3
Beds
1
Bath
3,734
Sq Ft
$267/Sq Ft
Est. Value
About This Home
This home is located at 7338 W Clarence Ave, Chicago, IL 60631 and is currently estimated at $998,007, approximately $267 per square foot. 7338 W Clarence Ave is a home located in Cook County with nearby schools including Edison Park Elementary School, Taft High School, and Immaculate Conception School.
Ownership History
Date
Name
Owned For
Owner Type
Purchase Details
Closed on
Aug 13, 2021
Sold by
Mcveigh Myles
Bought by
Mcveigh Myles and Carberry Sinead
Current Estimated Value
Purchase Details
Closed on
Mar 18, 2021
Sold by
Belvedere Financial Llc
Bought by
Mcveigh Myles
Purchase Details
Closed on
Nov 21, 2017
Sold by
Mcveigh Myles
Bought by
Belvedere Financial Llc
Purchase Details
Closed on
Aug 31, 2005
Sold by
Stenson Joseph
Bought by
Mcveigh Myles
Purchase Details
Closed on
Jun 21, 2002
Sold by
Birkmann Betty and Lechowski James J
Bought by
Stenson Joseph
Home Financials for this Owner
Home Financials are based on the most recent Mortgage that was taken out on this home.
Original Mortgage
$188,000
Interest Rate
7.75%
Purchase Details
Closed on
Feb 8, 1999
Sold by
Fowler Mary
Bought by
Lechowski James J
Purchase Details
Closed on
May 19, 1998
Sold by
Lechowski James
Bought by
Birkman Betty and Fowler Mary
Create a Home Valuation Report for This Property
The Home Valuation Report is an in-depth analysis detailing your home's value as well as a comparison with similar homes in the area
Home Values in the Area
Average Home Value in this Area
Purchase History
| Date | Buyer | Sale Price | Title Company |
|---|---|---|---|
| Mcveigh Myles | -- | Attorney | |
| Mcveigh Myles | $325,000 | Fidelity National Title | |
| Belvedere Financial Llc | $270,000 | North American Title | |
| Mcveigh Myles | $375,000 | Prairie Title | |
| Stenson Joseph | -- | -- | |
| Lechowski James J | $53,500 | -- | |
| Birkman Betty | -- | -- |
Source: Public Records
Mortgage History
| Date | Status | Borrower | Loan Amount |
|---|---|---|---|
| Previous Owner | Stenson Joseph | $188,000 | |
| Closed | Stenson Joseph | $47,000 |
Source: Public Records
Tax History Compared to Growth
Tax History
| Year | Tax Paid | Tax Assessment Tax Assessment Total Assessment is a certain percentage of the fair market value that is determined by local assessors to be the total taxable value of land and additions on the property. | Land | Improvement |
|---|---|---|---|---|
| 2024 | $18,989 | $102,000 | $16,250 | $85,750 |
| 2023 | $18,511 | $90,000 | $13,000 | $77,000 |
| 2022 | $18,511 | $90,000 | $13,000 | $77,000 |
| 2021 | $18,098 | $90,000 | $13,000 | $77,000 |
| 2020 | $18,806 | $84,421 | $8,125 | $76,296 |
| 2019 | $11,685 | $58,160 | $8,125 | $50,035 |
| 2018 | $8,113 | $41,070 | $8,125 | $32,945 |
| 2017 | $6,998 | $32,506 | $7,150 | $25,356 |
| 2016 | $6,511 | $32,506 | $7,150 | $25,356 |
| 2015 | $6,270 | $34,217 | $7,150 | $27,067 |
| 2014 | $5,390 | $29,052 | $6,500 | $22,552 |
| 2013 | $5,284 | $29,052 | $6,500 | $22,552 |
Source: Public Records
Map
Nearby Homes
- 7425 W Devon Ave
- 7204 W Myrtle Ave
- 6466 N Northwest Hwy Unit C1
- 6462 N Northwest Hwy Unit 104
- 6253 N Harlem Ave
- 6490 N Northwest Hwy Unit 3F
- 6211 N Harlem Ave
- 6067 N Oconto Ave
- 6500 N Northwest Hwy
- 6524 N Northwest Hwy Unit A
- 6453 N Northwest Hwy Unit C5
- 5949 N Odell Ave Unit 2E
- 5975 N Odell Ave Unit 4G
- 5975 N Odell Ave Unit 1B
- 5975 N Odell Ave Unit 4F
- 6212 N Avondale Ave
- 7725 W Myrtle Ave
- 5933 N Harlem Ave
- 6625 N Northwest Hwy Unit 202
- 1220 Canfield Rd
- 7400 W Clarence Ave
- 7334 W Clarence Ave
- 7402 W Clarence Ave
- 7332 W Clarence Ave
- 7332 W Clarence Ave Unit G
- 7332 W Clarence Ave Unit GARDEN
- 7406 W Clarence Ave
- 7330 W Clarence Ave
- 7326 W Clarence Ave
- 7410 W Clarence Ave
- 7401 W Palatine Ave
- 7401 W Palatine Ave
- 7337 W Palatine Ave
- 7333 W Palatine Ave
- 7324 W Clarence Ave
- 7405 W Palatine Ave
- 7331 W Palatine Ave
- 7414 W Clarence Ave
- 7414 W Clarence Ave
- 7409 W Palatine Ave