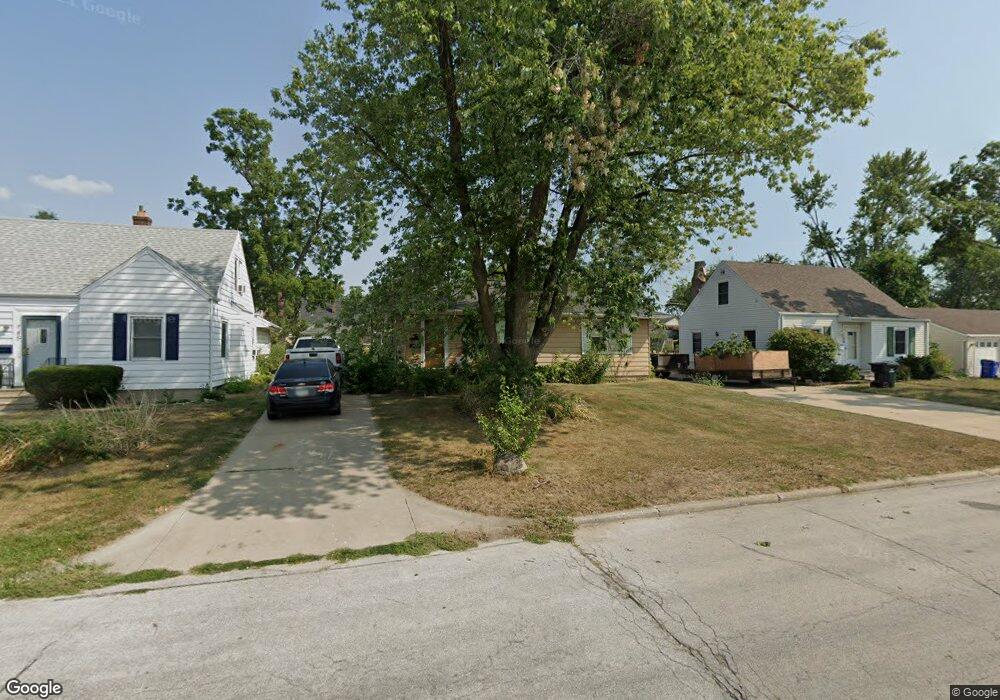
734 25th St NE Cedar Rapids, IA 52402
Mound View NeighborhoodEstimated Value: $155,000 - $175,000
3
Beds
2
Baths
896
Sq Ft
$185/Sq Ft
Est. Value
About This Home
This home is located at 734 25th St NE, Cedar Rapids, IA 52402 and is currently estimated at $165,526, approximately $184 per square foot. 734 25th St NE is a home located in Linn County with nearby schools including Arthur Elementary School, Franklin Middle School, and George Washington High School.
Ownership History
Date
Name
Owned For
Owner Type
Purchase Details
Closed on
Jan 27, 1998
Sold by
Miller Rosemary S
Bought by
Ehrenberger Elizabeth C and Cass Eleanor D
Current Estimated Value
Home Financials for this Owner
Home Financials are based on the most recent Mortgage that was taken out on this home.
Original Mortgage
$60,000
Outstanding Balance
$10,735
Interest Rate
7.12%
Estimated Equity
$154,791
Create a Home Valuation Report for This Property
The Home Valuation Report is an in-depth analysis detailing your home's value as well as a comparison with similar homes in the area
Home Values in the Area
Average Home Value in this Area
Purchase History
| Date | Buyer | Sale Price | Title Company |
|---|---|---|---|
| Ehrenberger Elizabeth C | $74,500 | -- |
Source: Public Records
Mortgage History
| Date | Status | Borrower | Loan Amount |
|---|---|---|---|
| Open | Ehrenberger Elizabeth C | $60,000 |
Source: Public Records
Tax History Compared to Growth
Tax History
| Year | Tax Paid | Tax Assessment Tax Assessment Total Assessment is a certain percentage of the fair market value that is determined by local assessors to be the total taxable value of land and additions on the property. | Land | Improvement |
|---|---|---|---|---|
| 2025 | $2,138 | $144,700 | $33,700 | $111,000 |
| 2024 | $2,188 | $135,800 | $31,000 | $104,800 |
| 2023 | $2,188 | $131,300 | $31,000 | $100,300 |
| 2022 | $218,800 | $112,600 | $25,600 | $87,000 |
| 2021 | $2,054 | $108,100 | $25,600 | $82,500 |
| 2020 | $2,114 | $104,400 | $22,900 | $81,500 |
| 2019 | $1,974 | $100,100 | $22,900 | $77,200 |
| 2018 | $1,916 | $100,100 | $22,900 | $77,200 |
| 2017 | $1,952 | $98,200 | $22,900 | $75,300 |
| 2016 | $2,115 | $99,500 | $22,900 | $76,600 |
| 2015 | $2,137 | $100,459 | $26,950 | $73,509 |
| 2014 | $1,952 | $100,459 | $26,950 | $73,509 |
| 2013 | $1,894 | $100,459 | $26,950 | $73,509 |
Source: Public Records
Map
Nearby Homes