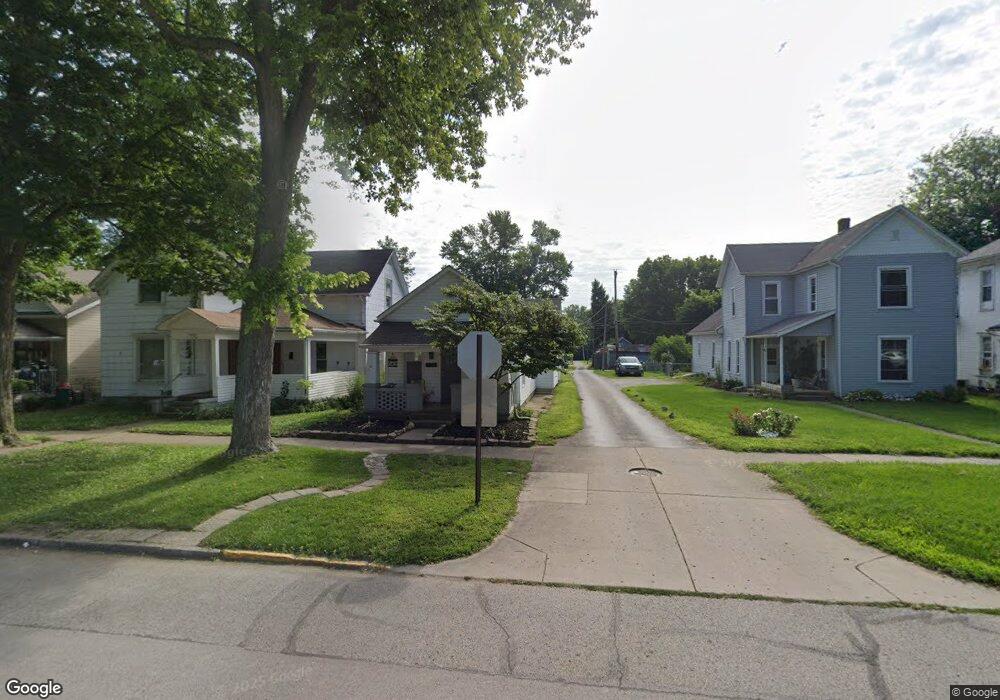
734 S Main Ave Sidney, OH 45365
Estimated Value: $91,000 - $152,000
3
Beds
1
Bath
960
Sq Ft
$116/Sq Ft
Est. Value
About This Home
This home is located at 734 S Main Ave, Sidney, OH 45365 and is currently estimated at $111,041, approximately $115 per square foot. 734 S Main Ave is a home located in Shelby County with nearby schools including Sidney High School, Holy Angels Catholic School, and Christian Academy Schools.
Ownership History
Date
Name
Owned For
Owner Type
Purchase Details
Closed on
Jun 1, 2015
Sold by
Wagner Nancy J
Bought by
Shreves Corey G
Current Estimated Value
Purchase Details
Closed on
Jun 10, 2014
Sold by
Estate Of Jeffrey A Wagner
Bought by
Wagner Nancy J
Purchase Details
Closed on
May 21, 2008
Sold by
Us Bank Na
Bought by
Wagner Jeffrey A
Home Financials for this Owner
Home Financials are based on the most recent Mortgage that was taken out on this home.
Original Mortgage
$280,000
Interest Rate
5.93%
Mortgage Type
Purchase Money Mortgage
Purchase Details
Closed on
Feb 29, 2008
Sold by
Knapke Barbara and Knapke Jerald A
Bought by
Us Bank Na and Asset Backed Securities Corp Home Equity
Purchase Details
Closed on
Jun 22, 1992
Bought by
Knapke Jerald
Create a Home Valuation Report for This Property
The Home Valuation Report is an in-depth analysis detailing your home's value as well as a comparison with similar homes in the area
Home Values in the Area
Average Home Value in this Area
Purchase History
| Date | Buyer | Sale Price | Title Company |
|---|---|---|---|
| Shreves Corey G | $20,000 | Attorney | |
| Wagner Nancy J | -- | None Available | |
| Wagner Jeffrey A | $34,000 | None Available | |
| Us Bank Na | $40,000 | None Available | |
| Knapke Jerald | $33,000 | -- |
Source: Public Records
Mortgage History
| Date | Status | Borrower | Loan Amount |
|---|---|---|---|
| Previous Owner | Wagner Jeffrey A | $280,000 |
Source: Public Records
Tax History Compared to Growth
Tax History
| Year | Tax Paid | Tax Assessment Tax Assessment Total Assessment is a certain percentage of the fair market value that is determined by local assessors to be the total taxable value of land and additions on the property. | Land | Improvement |
|---|---|---|---|---|
| 2024 | $864 | $22,190 | $2,960 | $19,230 |
| 2023 | $822 | $22,190 | $2,960 | $19,230 |
| 2022 | $636 | $15,520 | $2,200 | $13,320 |
| 2021 | $642 | $15,520 | $2,200 | $13,320 |
| 2020 | $642 | $15,520 | $2,200 | $13,320 |
| 2019 | $555 | $13,450 | $1,860 | $11,590 |
| 2018 | $700 | $13,450 | $1,860 | $11,590 |
| 2017 | $544 | $13,450 | $1,860 | $11,590 |
| 2016 | $453 | $11,190 | $1,860 | $9,330 |
| 2015 | $454 | $11,190 | $1,860 | $9,330 |
| 2014 | $454 | $11,190 | $1,860 | $9,330 |
| 2013 | $462 | $10,520 | $1,860 | $8,660 |
Source: Public Records
Map
Nearby Homes
- 620 S Ohio Ave
- 608 S Ohio Ave
- 420 S Ohio Ave
- 131 Mound St
- 109 E Water St
- 119 & 121 W Water St
- 330 S Walnut Ave
- 747 Chestnut Ave
- 812 Chestnut Ave
- 321 Oldham Ave
- 805 Chestnut Ave
- 414 & 416 E Court St
- 608 Foraker Ave
- 610 Fair Rd
- 649 Fair Rd
- 413 E Poplar St
- 115 Brooklyn Ave
- 105 N Ohio Ave Unit C
- 107 N Ohio Ave Unit C
- 518 Rauth St
- 732 S Main Ave
- 804 S Main Ave
- 728 S Main Ave
- 724 S Main Ave
- 806 S Main Ave
- 722 S Main Ave
- 810 S Main Ave
- 733 S Miami Ave
- 729 S Miami Ave
- 816 S Main Ave
- 725 S Miami Ave
- 818 S Main Ave
- 801 S Miami Ave
- 811 S Main Ave
- 809 S Miami Ave
- 815 S Miami Ave
- 731 S Main Ave
- 721 S Miami Ave
- 717 S Main Ave
- 717 S Main Ave