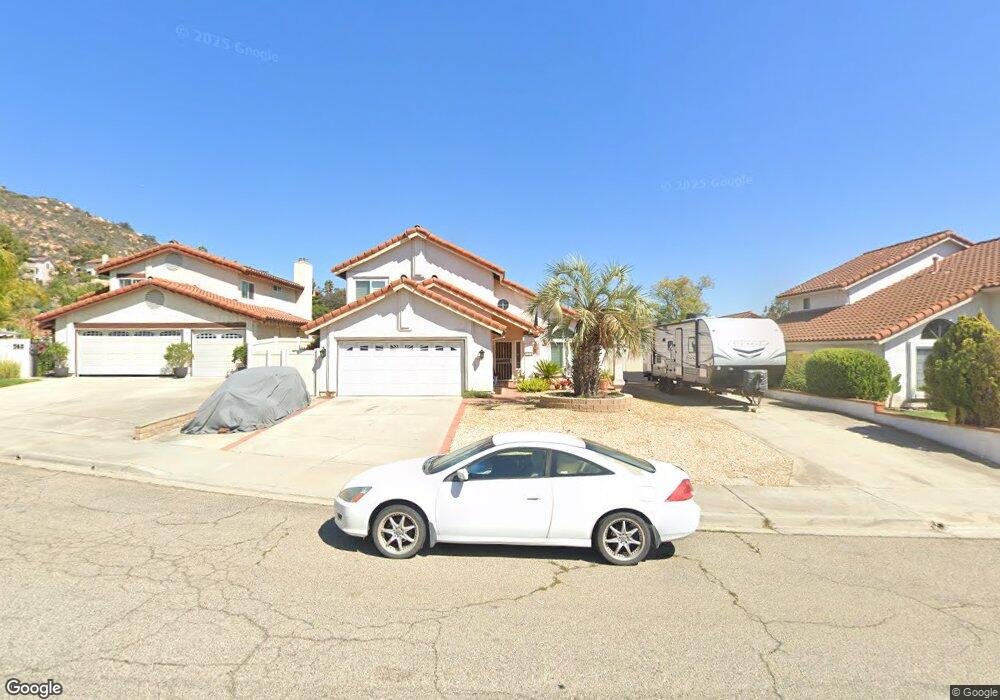
734 Springlake Place Escondido, CA 92027
East Grove NeighborhoodEstimated Value: $798,000 - $835,000
3
Beds
3
Baths
1,614
Sq Ft
$510/Sq Ft
Est. Value
About This Home
This home is located at 734 Springlake Place, Escondido, CA 92027 and is currently estimated at $822,397, approximately $509 per square foot. 734 Springlake Place is a home located in San Diego County with nearby schools including Glen View Elementary School, Hidden Valley Middle School, and Orange Glen High School.
Ownership History
Date
Name
Owned For
Owner Type
Purchase Details
Closed on
Oct 8, 2021
Sold by
Milla Sandra
Bought by
Milla Sandra and The Sandra Milla Trust
Current Estimated Value
Purchase Details
Closed on
Aug 22, 2013
Sold by
Milla Oscar and Milla Sandra
Bought by
Milla Oscar Manuel and Milla Sandra
Home Financials for this Owner
Home Financials are based on the most recent Mortgage that was taken out on this home.
Original Mortgage
$312,550
Outstanding Balance
$233,541
Interest Rate
4.51%
Mortgage Type
VA
Estimated Equity
$588,856
Purchase Details
Closed on
Aug 24, 1995
Sold by
Cassidy Marjorye K Rogers and Rogers Marjorye K
Bought by
Milla Oscar and Milla Sandra
Home Financials for this Owner
Home Financials are based on the most recent Mortgage that was taken out on this home.
Original Mortgage
$115,000
Interest Rate
7.5%
Purchase Details
Closed on
Nov 15, 1993
Sold by
Rogers Marjorye K
Bought by
Rogers Marjorye K
Purchase Details
Closed on
Apr 7, 1988
Create a Home Valuation Report for This Property
The Home Valuation Report is an in-depth analysis detailing your home's value as well as a comparison with similar homes in the area
Home Values in the Area
Average Home Value in this Area
Purchase History
| Date | Buyer | Sale Price | Title Company |
|---|---|---|---|
| Milla Sandra | -- | None Available | |
| Milla Oscar Manuel | -- | Fidelity National Title Co | |
| Milla Oscar | $165,000 | Old Republic Title Company | |
| Rogers Marjorye K | -- | -- | |
| -- | $144,900 | -- |
Source: Public Records
Mortgage History
| Date | Status | Borrower | Loan Amount |
|---|---|---|---|
| Open | Milla Oscar Manuel | $312,550 | |
| Closed | Milla Oscar | $115,000 |
Source: Public Records
Tax History Compared to Growth
Tax History
| Year | Tax Paid | Tax Assessment Tax Assessment Total Assessment is a certain percentage of the fair market value that is determined by local assessors to be the total taxable value of land and additions on the property. | Land | Improvement |
|---|---|---|---|---|
| 2025 | $3,016 | $274,073 | $92,033 | $182,040 |
| 2024 | $3,016 | $268,700 | $90,229 | $178,471 |
| 2023 | $2,946 | $263,432 | $88,460 | $174,972 |
| 2022 | $2,913 | $258,268 | $86,726 | $171,542 |
| 2021 | $2,865 | $253,205 | $85,026 | $168,179 |
| 2020 | $2,847 | $250,610 | $84,155 | $166,455 |
| 2019 | $2,777 | $245,697 | $82,505 | $163,192 |
| 2018 | $2,699 | $240,881 | $80,888 | $159,993 |
| 2017 | $2,654 | $236,158 | $79,302 | $156,856 |
| 2016 | $2,601 | $231,529 | $77,748 | $153,781 |
| 2015 | $2,578 | $228,053 | $76,581 | $151,472 |
| 2014 | $2,471 | $223,586 | $75,081 | $148,505 |
Source: Public Records
Map
Nearby Homes
- 770 Sungold Way
- 705 Sungold Way
- 2561 White Oak Place Unit 1
- 2402 Honeybell Ln
- 629 Pitman St
- 2428 Monroe Place
- 2469 Turnbridge Glen
- 609 Jacks Creek Rd
- 2313 E Lincoln Ave
- 2928 Burnet Dr
- 472 Devonshire Glen
- 840 Paula St
- 2700 E Valley Pkwy Unit 189
- 2700 E Valley Pkwy Unit Spc 81
- 2700 E Valley Pkwy Unit 315
- 2700 E Valley Pkwy Unit 64
- 2700e Valley Pkwy Unit 81
- 0 La Honda Dr
- 2141 E Mission Ave
- 2550 E Valley Pkwy Unit 122
- 726 Springlake Place
- 740 Springlake Place
- 731 Red Alder Place
- 737 Red Alder Place
- 721 Red Alder Place
- 722 Springlake Place
- 745 Red Alder Place
- 727 Springlake Place
- 735 Springlake Place
- 746 Springlake Place
- 715 Red Alder Place
- 723 Springlake Place
- 741 Springlake Place
- 751 Red Alder Place
- 747 Springlake Place
- 717 Springlake Place
- 2719 Prairiestone Way
- 00 Eagles Nest Gln Ave
- 2661 Fieldbrook Way
- 2700 Fieldbrook Way