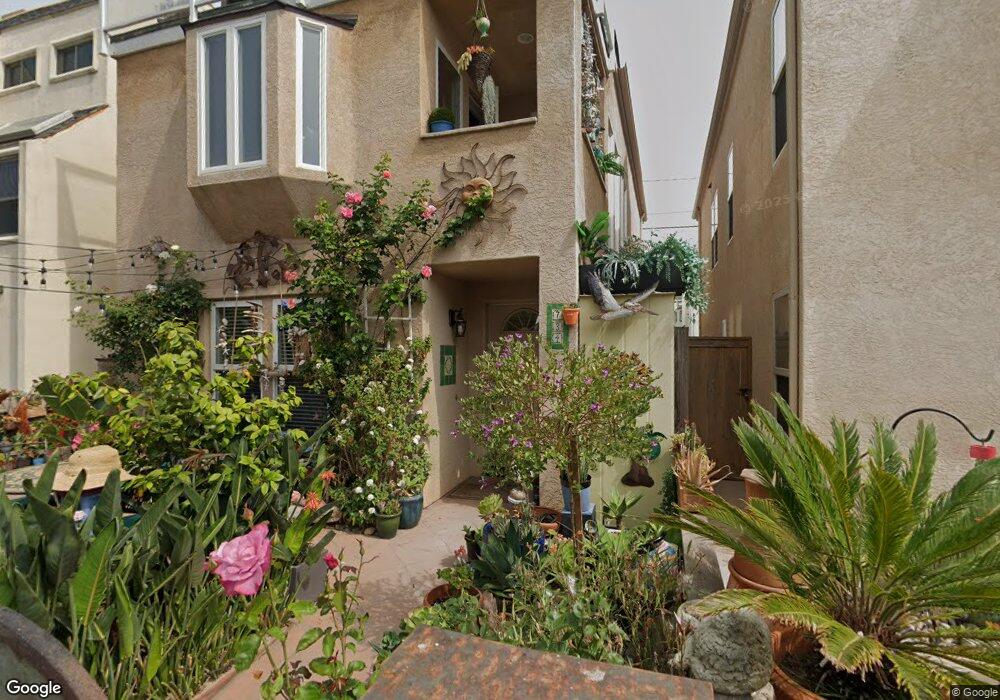
734 Windemere Ct Unit B San Diego, CA 92109
Mission Beach NeighborhoodEstimated Value: $2,381,000 - $2,692,000
6
Beds
5
Baths
2,774
Sq Ft
$938/Sq Ft
Est. Value
About This Home
This home is located at 734 Windemere Ct Unit B, San Diego, CA 92109 and is currently estimated at $2,602,756, approximately $938 per square foot. 734 Windemere Ct Unit B is a home located in San Diego County with nearby schools including Pacific Beach Elementary School, Pacific Beach Middle, and Mission Bay High School.
Ownership History
Date
Name
Owned For
Owner Type
Purchase Details
Closed on
Oct 27, 2020
Sold by
Larkin Thomas M and Larkin Deborah H
Bought by
Larkin Thomas M and Larkin Deborah H
Current Estimated Value
Home Financials for this Owner
Home Financials are based on the most recent Mortgage that was taken out on this home.
Original Mortgage
$227,500
Outstanding Balance
$202,443
Interest Rate
2.8%
Mortgage Type
New Conventional
Estimated Equity
$2,400,313
Purchase Details
Closed on
Nov 17, 2005
Sold by
Larkin Thomas M and Larkin Deborah H
Bought by
Larkin Thomas M and Larkin Deborah H
Purchase Details
Closed on
Oct 14, 1996
Sold by
Brunson Illina
Bought by
Brunson Illina and Brunson Howard E
Create a Home Valuation Report for This Property
The Home Valuation Report is an in-depth analysis detailing your home's value as well as a comparison with similar homes in the area
Home Values in the Area
Average Home Value in this Area
Purchase History
| Date | Buyer | Sale Price | Title Company |
|---|---|---|---|
| Larkin Thomas M | -- | Fidelity National Title | |
| Larkin Thomas M | -- | Fidelity National Title | |
| Larkin Thomas M | -- | -- | |
| Larkin Thomas M | -- | -- | |
| Brunson Illina | -- | -- |
Source: Public Records
Mortgage History
| Date | Status | Borrower | Loan Amount |
|---|---|---|---|
| Open | Larkin Thomas M | $227,500 |
Source: Public Records
Tax History Compared to Growth
Tax History
| Year | Tax Paid | Tax Assessment Tax Assessment Total Assessment is a certain percentage of the fair market value that is determined by local assessors to be the total taxable value of land and additions on the property. | Land | Improvement |
|---|---|---|---|---|
| 2025 | $12,043 | $1,003,066 | $738,643 | $264,423 |
| 2024 | $12,043 | $983,399 | $724,160 | $259,239 |
| 2023 | $11,774 | $964,117 | $709,961 | $254,156 |
| 2022 | $11,459 | $945,214 | $696,041 | $249,173 |
| 2021 | $11,378 | $926,682 | $682,394 | $244,288 |
| 2020 | $11,238 | $917,181 | $675,397 | $241,784 |
| 2019 | $11,036 | $899,198 | $662,154 | $237,044 |
| 2018 | $10,317 | $881,568 | $649,171 | $232,397 |
| 2017 | $80 | $864,284 | $636,443 | $227,841 |
| 2016 | $9,917 | $847,338 | $623,964 | $223,374 |
| 2015 | $9,770 | $834,611 | $614,592 | $220,019 |
| 2014 | $9,610 | $818,263 | $602,553 | $215,710 |
Source: Public Records
Map
Nearby Homes
- 749 York Ct
- 714 York Ct
- 737 Whiting Ct
- 710 Verona Ct
- 3921 Ocean Front Walk
- 4111 Bayard St
- 701 Sunset Ct
- 722 San Jose Place
- 713 San Jose Place
- 876 Thomas Ave
- 806 Redondo Ct
- 3755 Ocean Front Walk Unit 18
- 866 Grand Ave
- 841 Pismo Ct
- 821 Portsmouth Ct Unit E
- 1152-54 Pacific Beach Dr
- 4465 Ocean Blvd Unit 1
- 4475 Mission Blvd Unit 1
- 1221 Parker Place Unit 15
- 727 Ostend Ct
- 732 Windemere Ct
- 738 Windemere Ct
- 755 Windemere Ct
- 728 Windemere Ct
- 742 Windemere Ct
- 735 Windemere Ct
- 729 Windemere Ct
- 737 Windemere Ct
- 731 Yarmouth Ct
- 739 Yarmouth Ct
- 748 Windemere Ct
- 724 Windemere Ct
- 727 Windemere Ct
- 745 Windemere Ct
- 725 Yarmouth Ct
- 743 Yarmouth Ct
- 723 Windemere Ct
- 747 Windemere Ct
- 720 Windemere Ct
- 721 Yarmouth Ct